 by
by In this Python and Matplotlib tutorial, we explain
- How to set the size of the figure in Python and Matplotlib by using figsize(width,height) attribute.
- How to properly increase or decrease the font size of the figure labels and figure axes after changing the figure size.
- How to independently change the widht and height of the figure by using set_figwidth() and set_figheight(), respectively.
- How to change the default figure size in Python and Matplotlib by using “rcParams”, such that you do not need to manually change the figure size every time you generate the figure graph.
The YouTube video accompanying this webpage is given below.
How to Set the Figure Size in Python by Using figsize()
Let us first generate a simple figure by using the Python script given below.
# let us generate a basic plot in Matplotlib
import matplotlib.pyplot as plt
import numpy as np

# generate the x array
x=np.linspace(-5,5,100)

# generate the y-axis array
y=0.2*x**2

# generate a basic plot
plt.plot(x,y)
plt.xlabel('x')
plt.ylabel('y')
plt.savefig('fig1test.png', dpi=600)
plt.show()
First, we import the plotting function and the NumPy library. Then, we generate x array by using np.linspace(). Then, we generate an array of y values as a quadratic function of x array entries. To generate the basic plot we use plt.plot(x,y). We then set the x and y axes labels and, we save the figure by using the function savefig(). We save the figure by using the “png” file format. Finally, we plot the figure by using “plt.show()”. The generated figure is shown below.
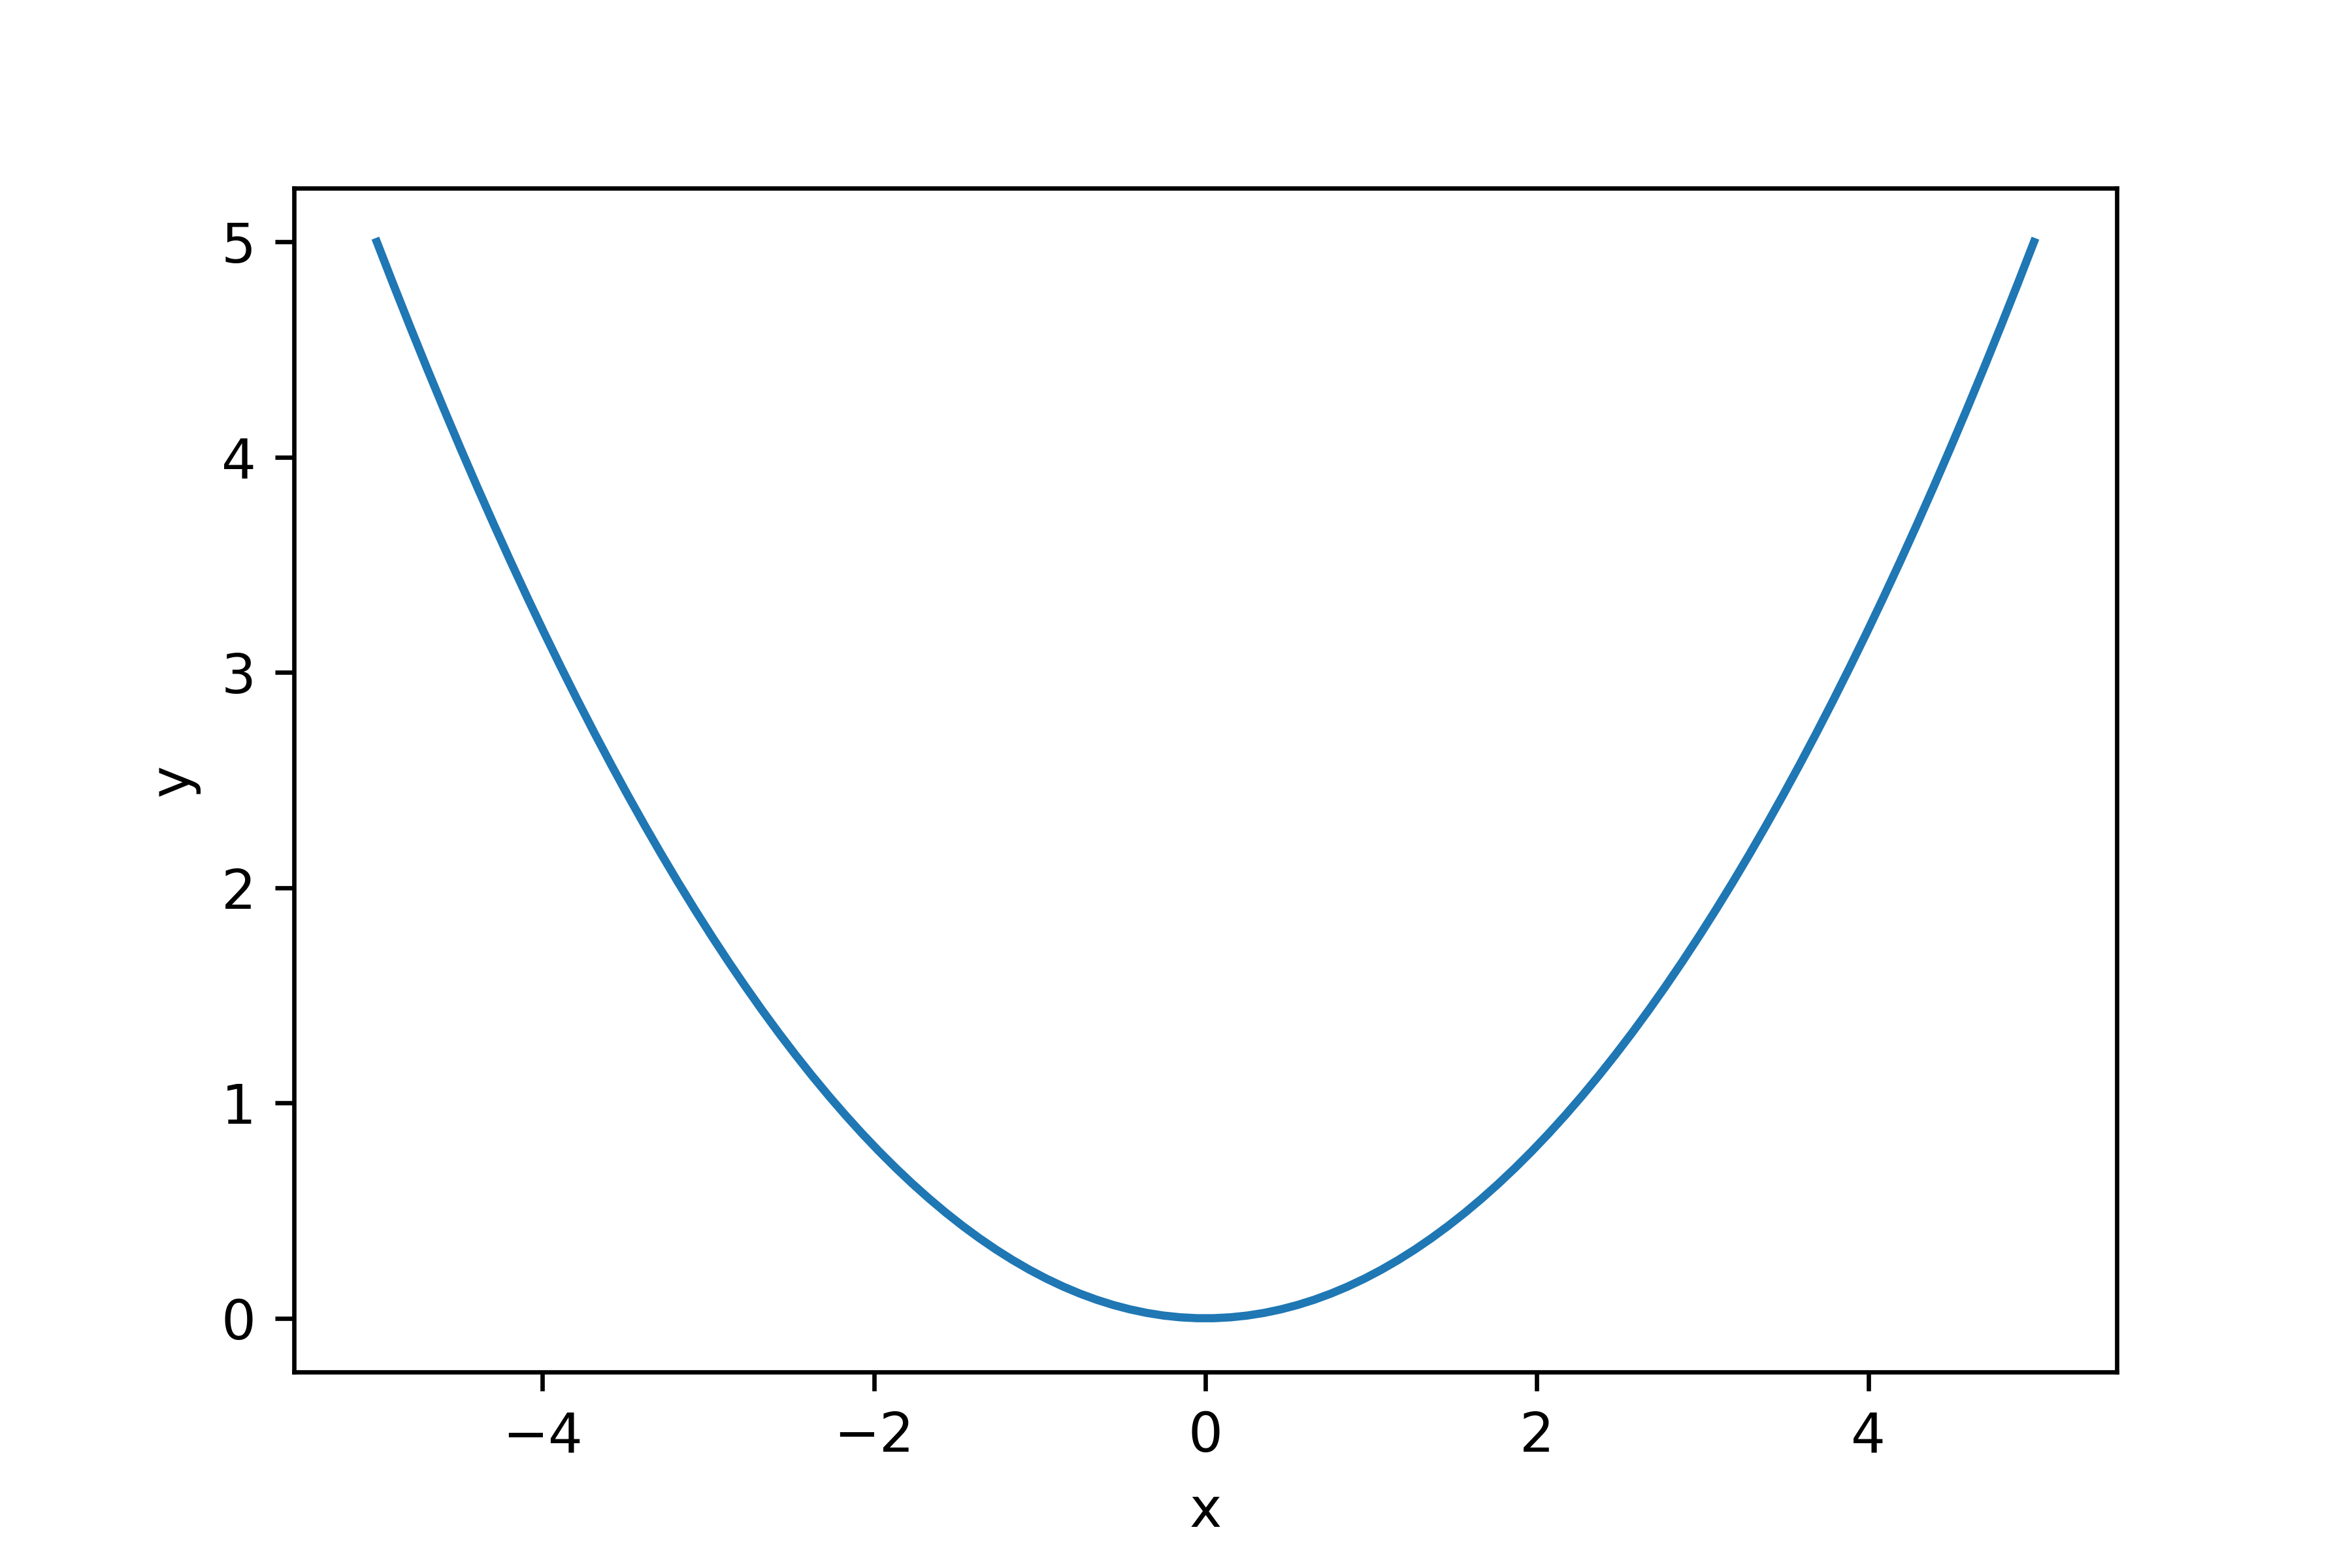
However, the generated figure might be too small. Consequently, we would like to change the figure width and height. To change the figure dimension we use the following script.
# here, we set the plot width and height
# we create a new figure and set the figure size
plt.figure(figsize=(8,8))
plt.plot(x,y)
plt.xlabel('x')
plt.ylabel('y')
plt.savefig('fig2test.png', dpi=600)
plt.show()
The function plt.figure() will create a new figure. Inside of this function, we set the figure size by using “figsize(WIDTH, HEIGHT)”. The first input of figsize() is the width of the new figure and the second input is the height of the new figure. The rest of the Python script is very similar to the previous Python script. The generated figure is given below.
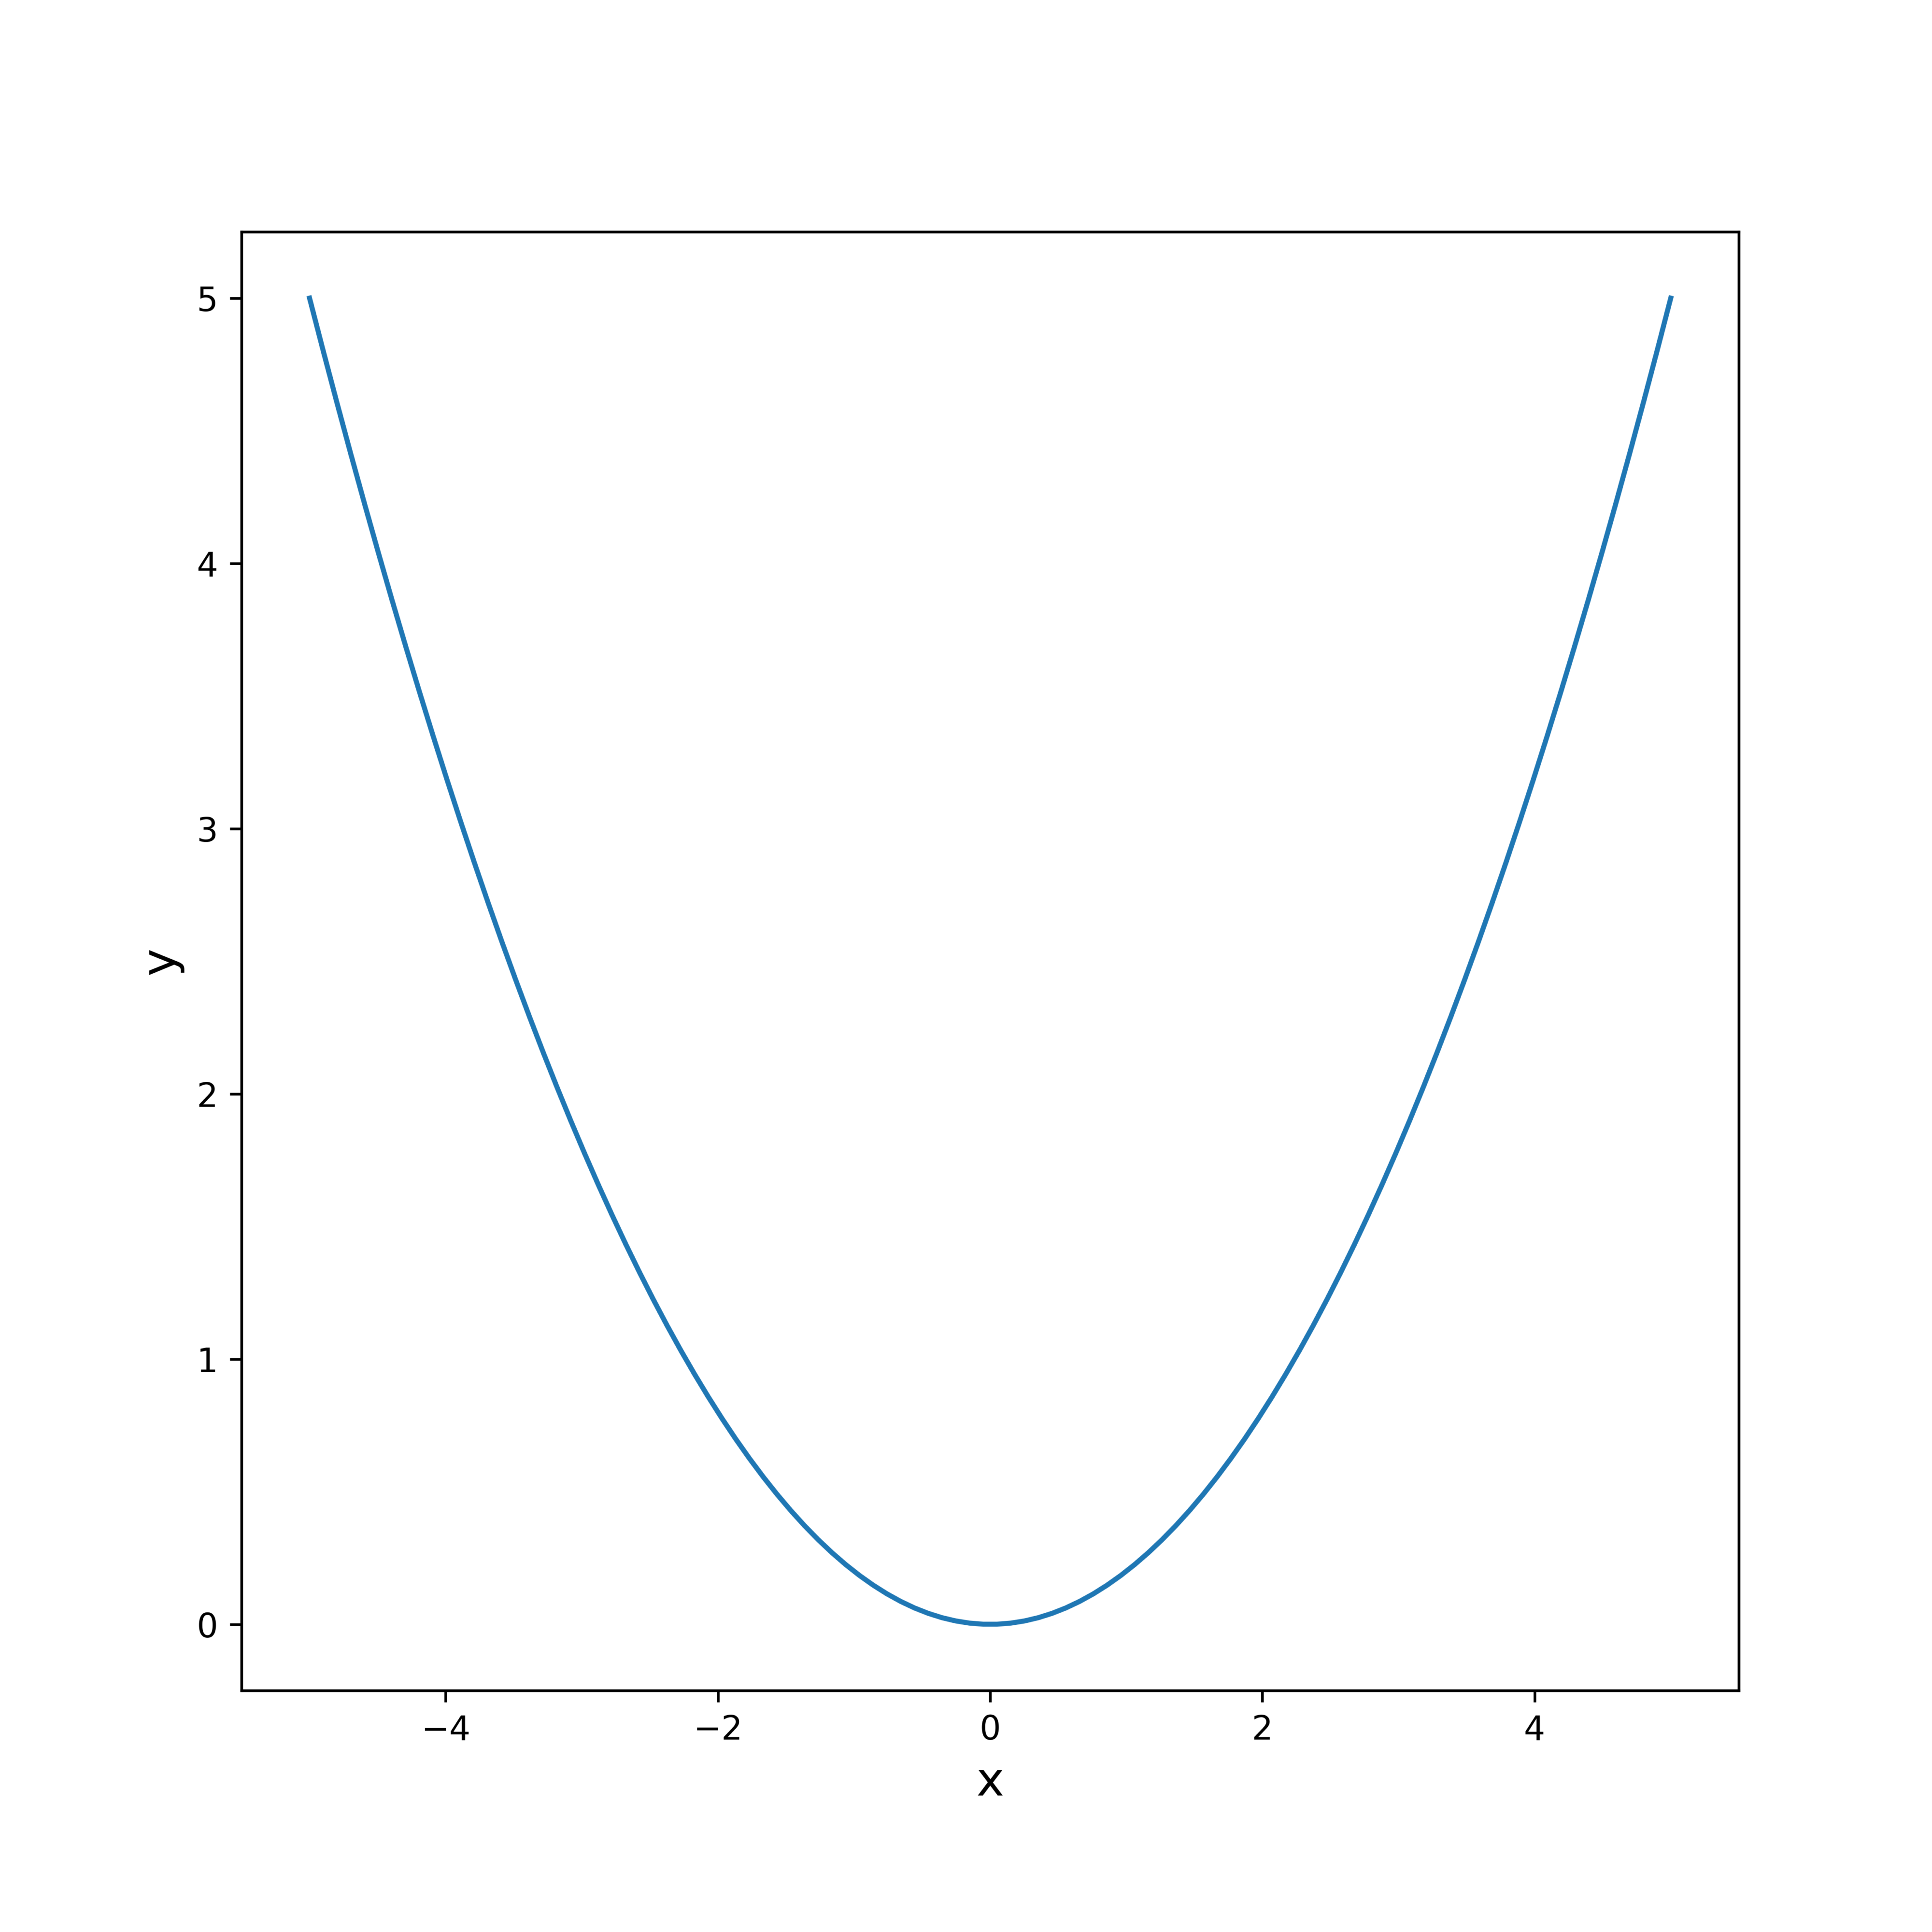
This new figure is definitely larger. However, the issue is that x and y axis fonts are not scaled by scaling the figure. Also, the issue is that label fonts are not scaled. Finally, the issue is that the line width is not scaled. To properly scale the labels, we use the following modification.
plt.figure(figsize=(8,8))
plt.plot(x,y,linewidth=4)
plt.xlabel('x', fontsize=16)
plt.ylabel('y',fontsize=16)
plt.tick_params(axis='both',which='major',labelsize=16)
plt.savefig('fig3test.png', dpi=600)
plt.show()
The resulting figure is shown below.
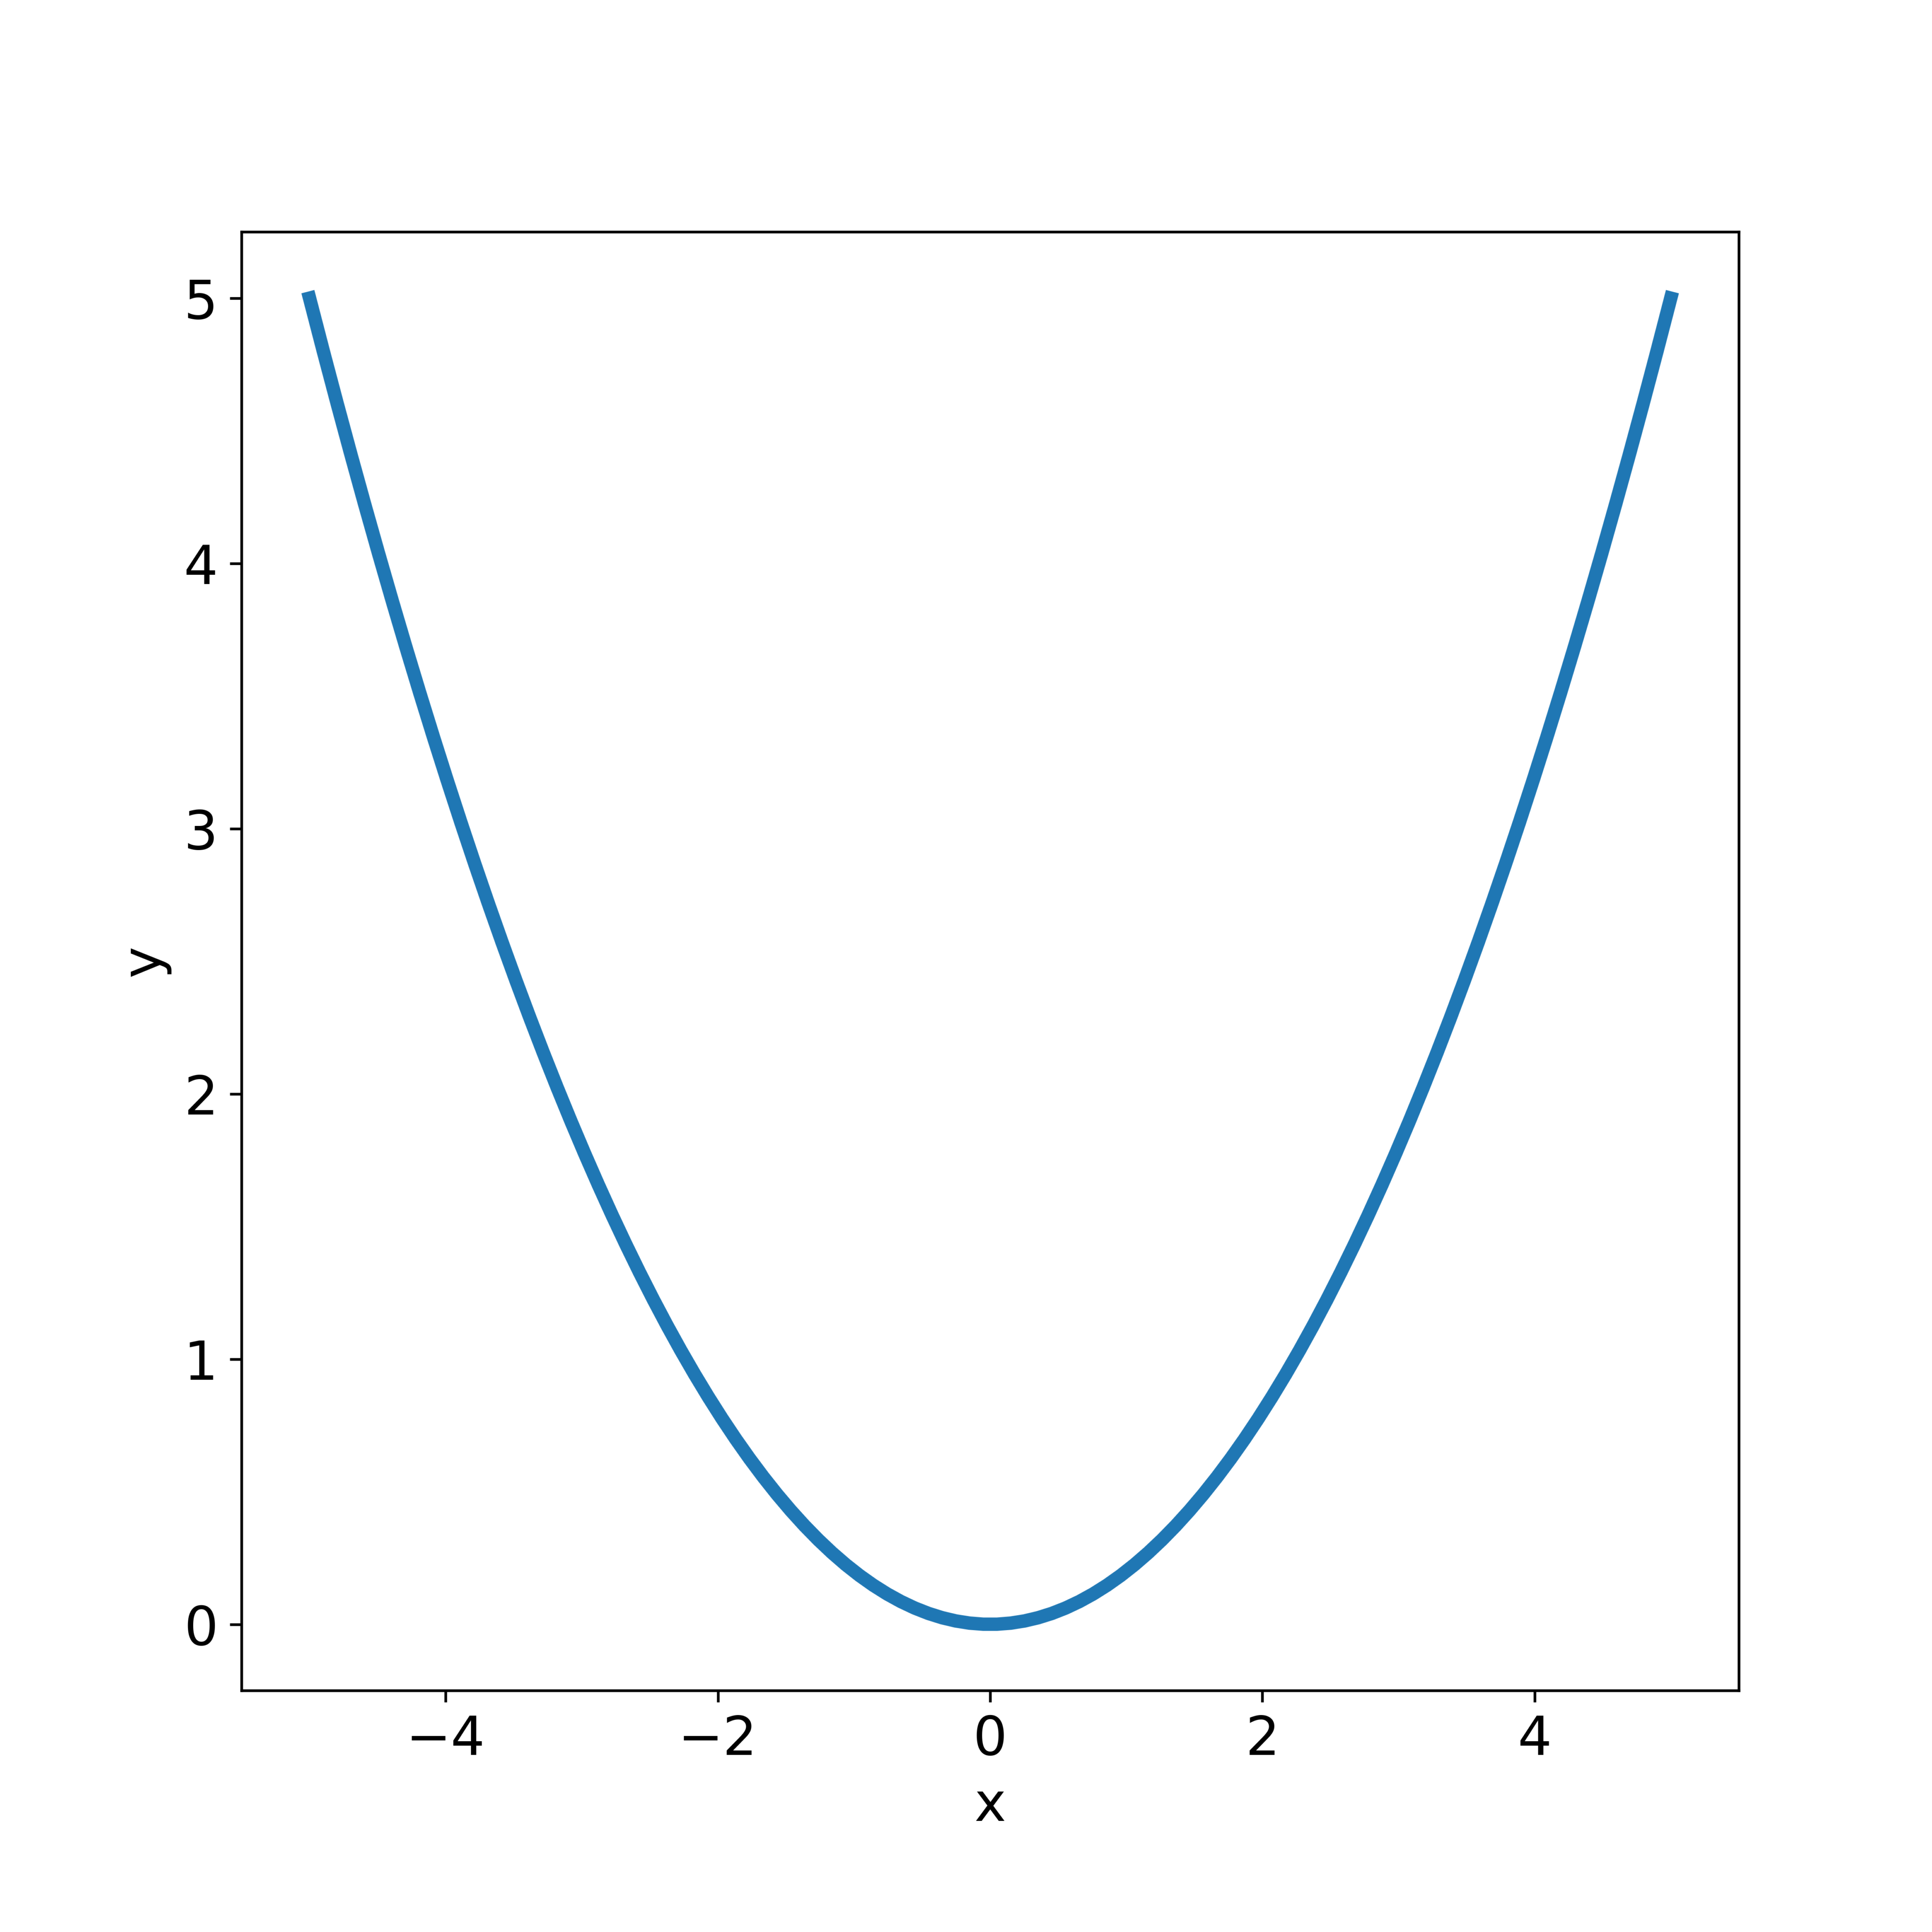
To scale the x and y label fonts, we simply set the property “fontsize” in the plt.xlabel() and plt.ylabel(). Then, with “plt.tick_params(axis=’both’,which=’major’,labelsize=16)”, we can adjust the x and y axis font dimensions.
How to Change the Width of Graph in Python and Matplotlib by using set_figwidth()
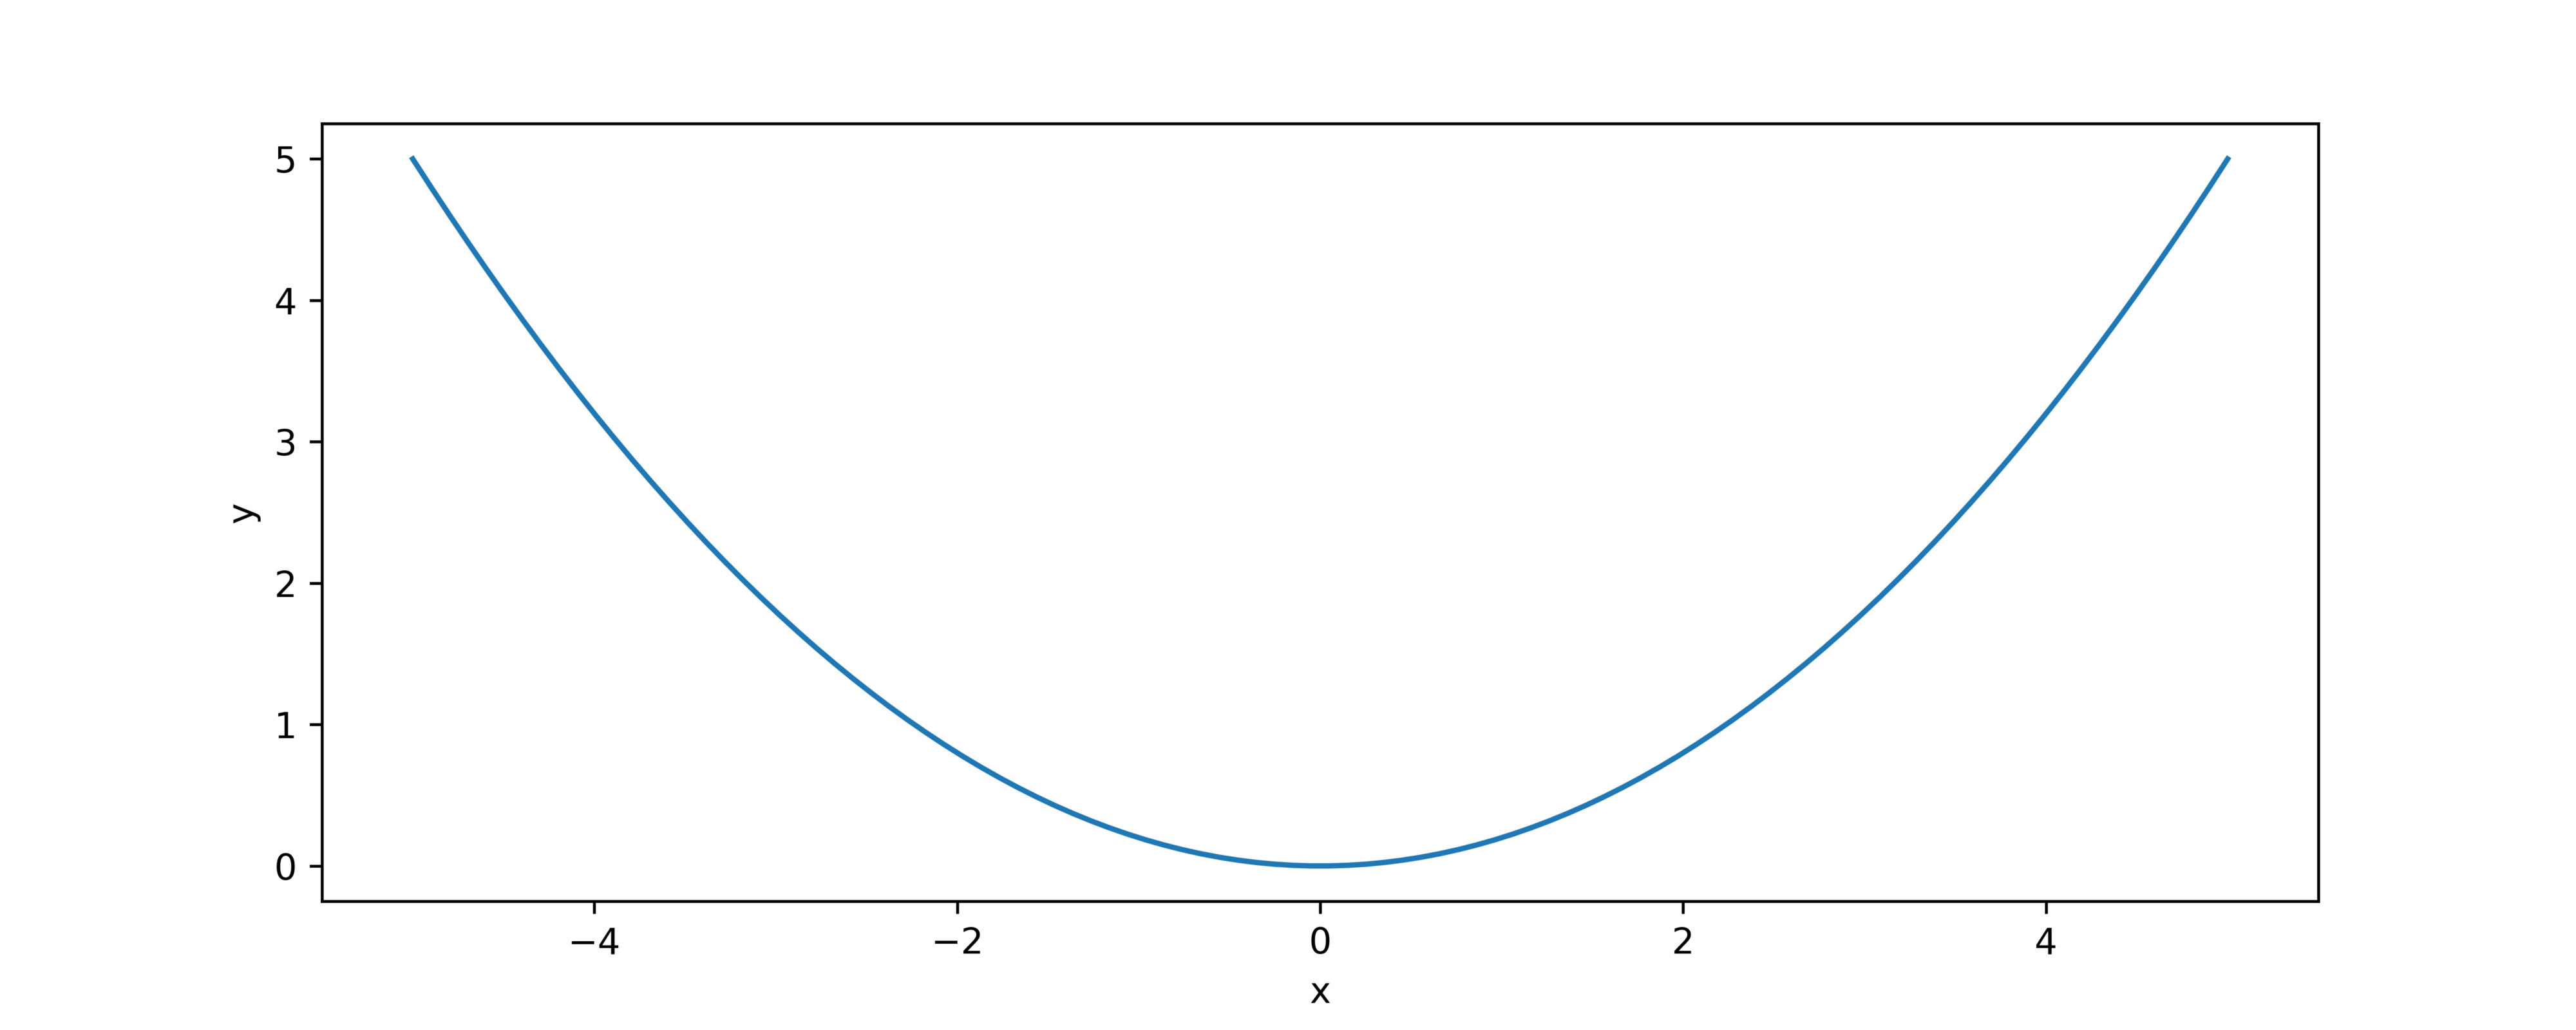
We can also independently change the width of a graph, without changing the height. We can do that by using the method set_figwidth() and the following script. The input of the function set_figwidth() is the new width of the figure.
plt.figure().set_figwidth(10)
plt.plot(x,y)
plt.xlabel('x')
plt.ylabel('y')
plt.savefig('fig4test.png', dpi=600)
plt.show()
The generated figure is shown below.
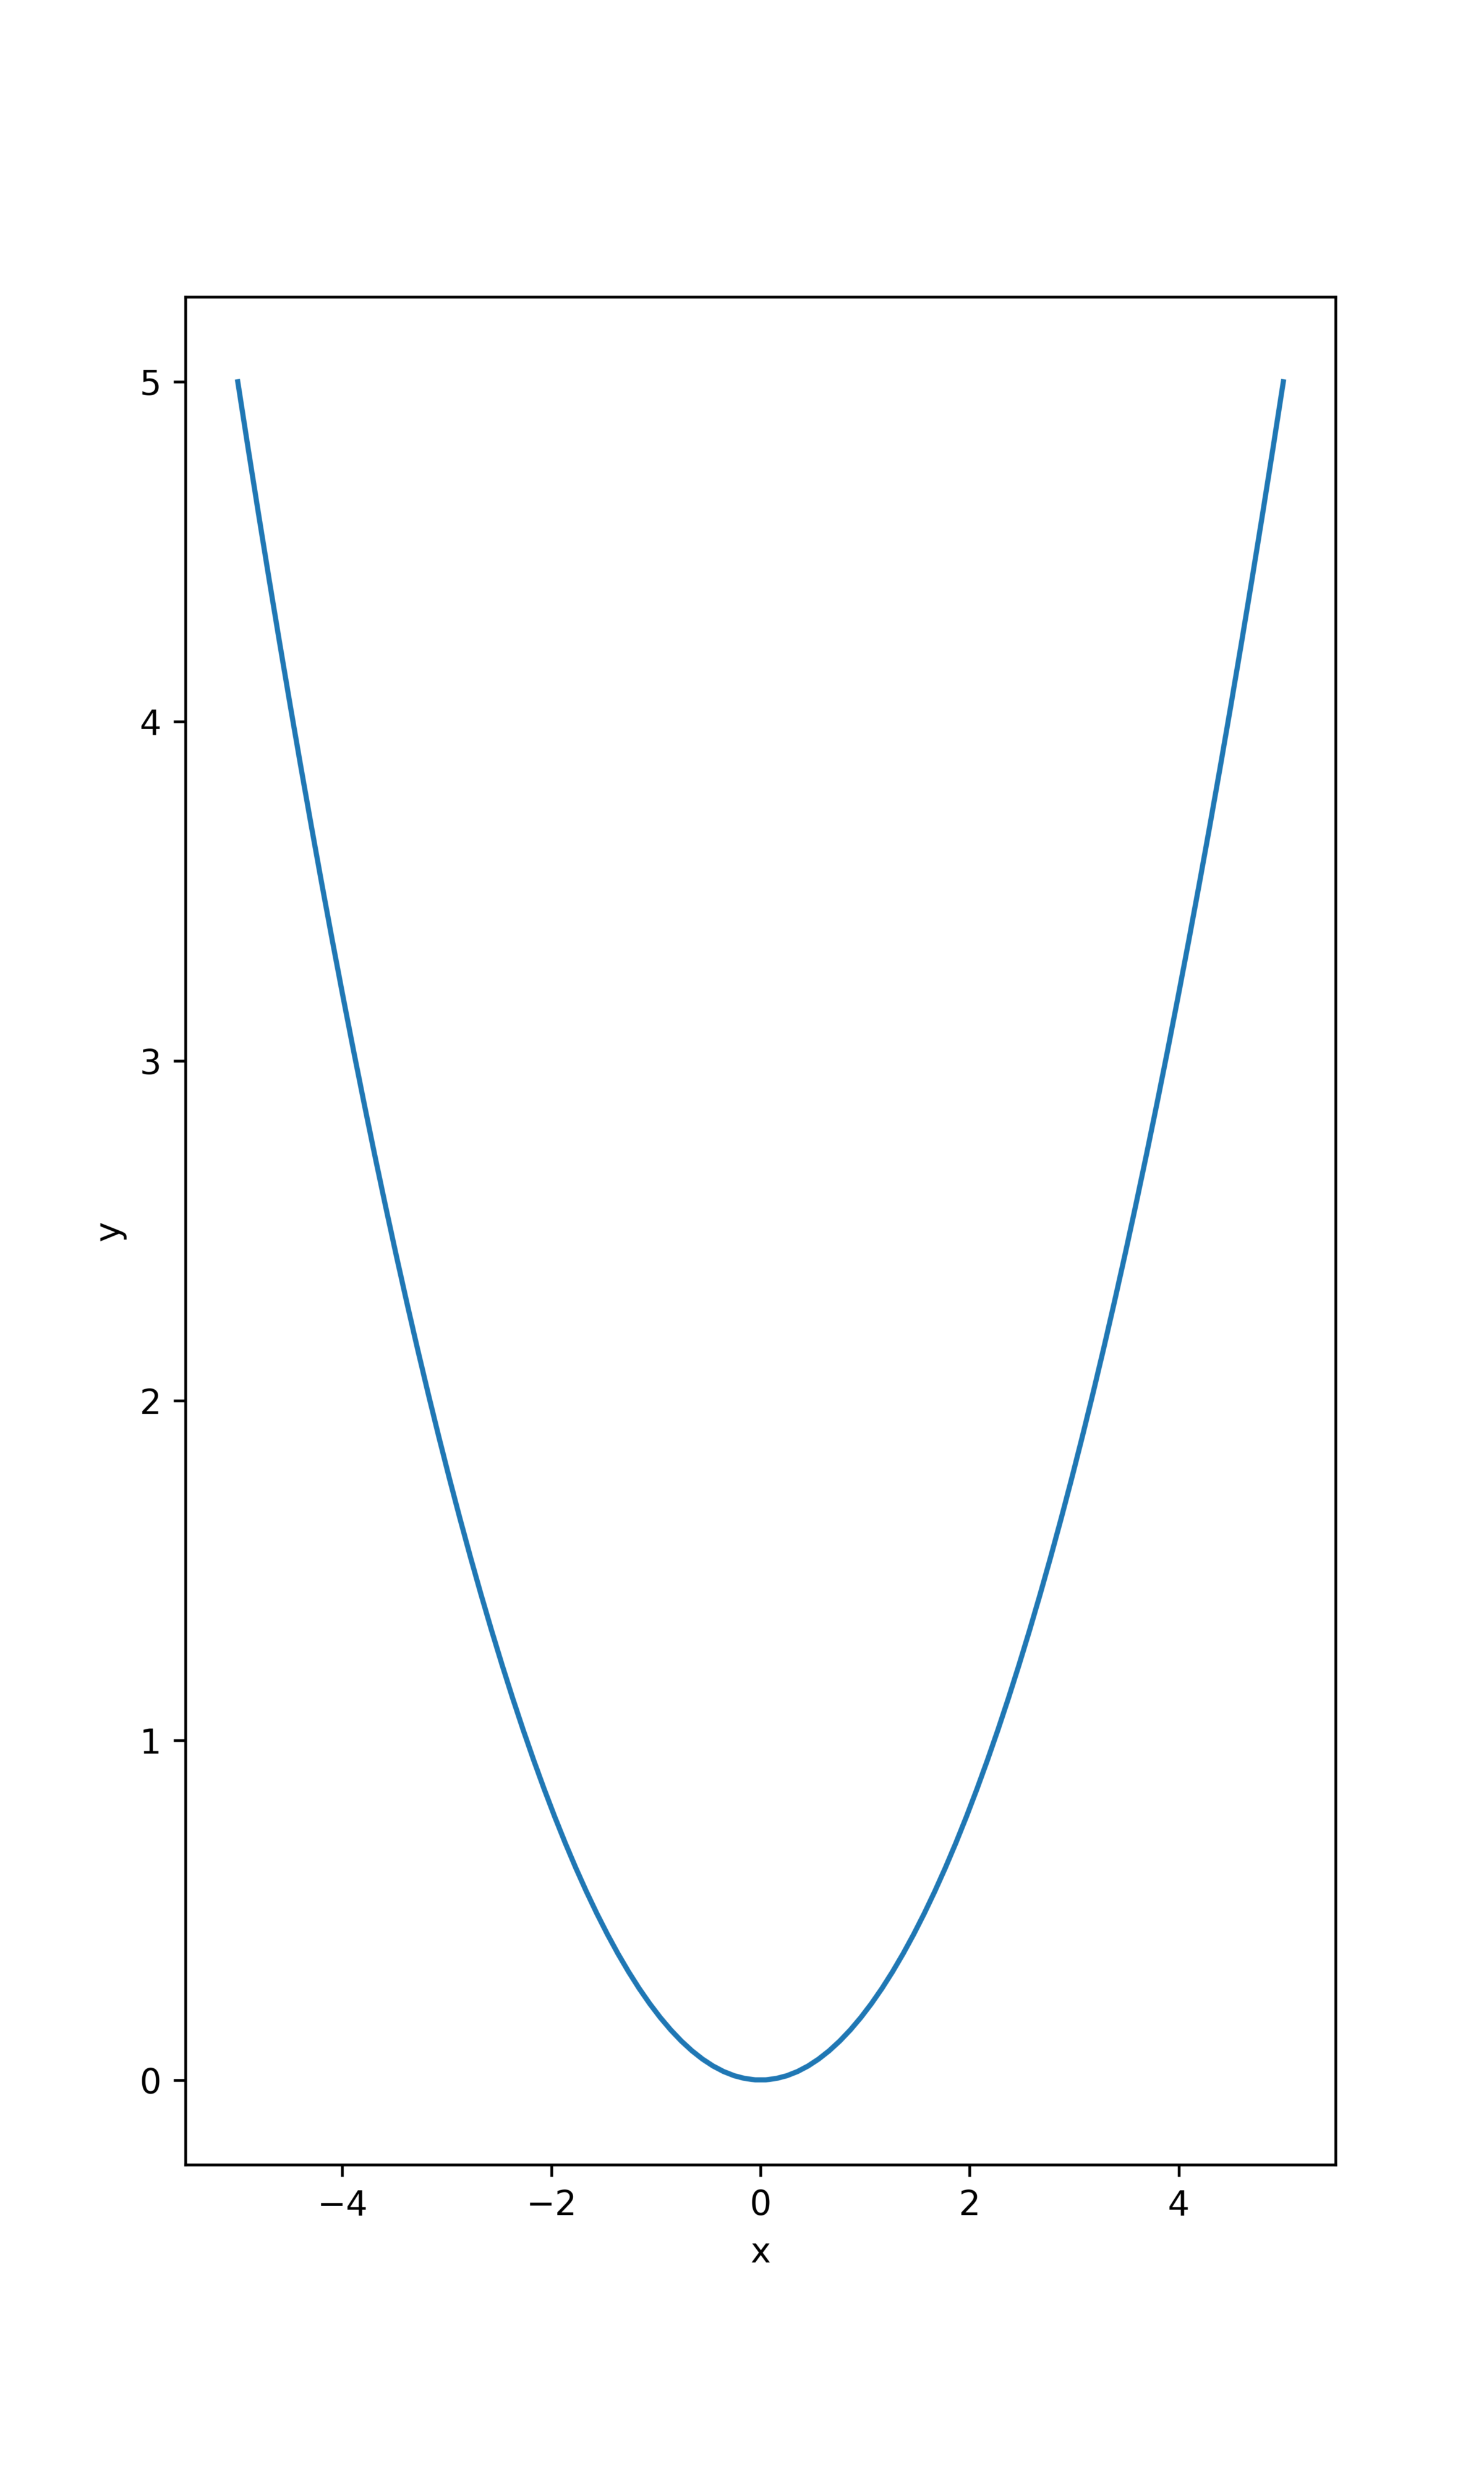
How to Change the Width of Graph in Python and Matplotlib by using set_figheight()
We can also independently change the height of a graph, without changing the height. We can do that by using the method set_figheight() and the following script. The input of the functionset_figheight() is the new height of the figure.
plt.figure().set_figheight(10)
plt.plot(x,y)
plt.xlabel('x')
plt.ylabel('y')
plt.savefig('fig5test.png', dpi=600)
plt.show()
The generated figure is shown below.
How to Change the Default Figure Size in Python and Matplotlib by using rcParams variable
Matplotlib has a parameter defining the default figure size. Every time we call “plt.plot()” Matplotlib will read this parameter and it will set the graph size. We can change the default value of the figure size parameter by changing rcParams variable.
The following script explains how to do that.
import numpy as np
import matplotlib.pyplot as plt

# generate the x array
x=np.linspace(-5,5,100)

# generate the y-axis array
y=0.2*x**2

plt.rcParams['figure.figsize'] = [12, 8]
plt.plot(x,y)
plt.xlabel('x')
plt.ylabel('y')
plt.savefig('fig9test.png', dpi=600)
plt.show()
To change the default figure size, we use “plt.rcParams[‘figure.figsize’] = [12, 8]”. The variable rcParams is a dictionary looking variable having keys and values. The key we are adjusting is “figure.figsize”. The value “[12,8]” is the new default figure size. Now, every time we call “plt.plot()”, figures will be generated with the new figure size “[12,8]”.