 by
by
In this Python, Pyplot, and Matplotlib tutorial, we explain how to save graphs to different file formats. As a test case, we first generate a simple graph in Python by using Pyplot and Matplotlib. Then, we explain how to save this graph as an image file, such as PNG or JPG files, or as a PDF file that can later be included in a scientific article or a report.
The YouTube tutorial accompanying this webpage tutorial is given below.
Let us first generate a simple graph. The Python script is given below.
import matplotlib.pyplot as plt
import numpy as np
# x-axis array
x=np.linspace(-8,8,100)
# y-axis array
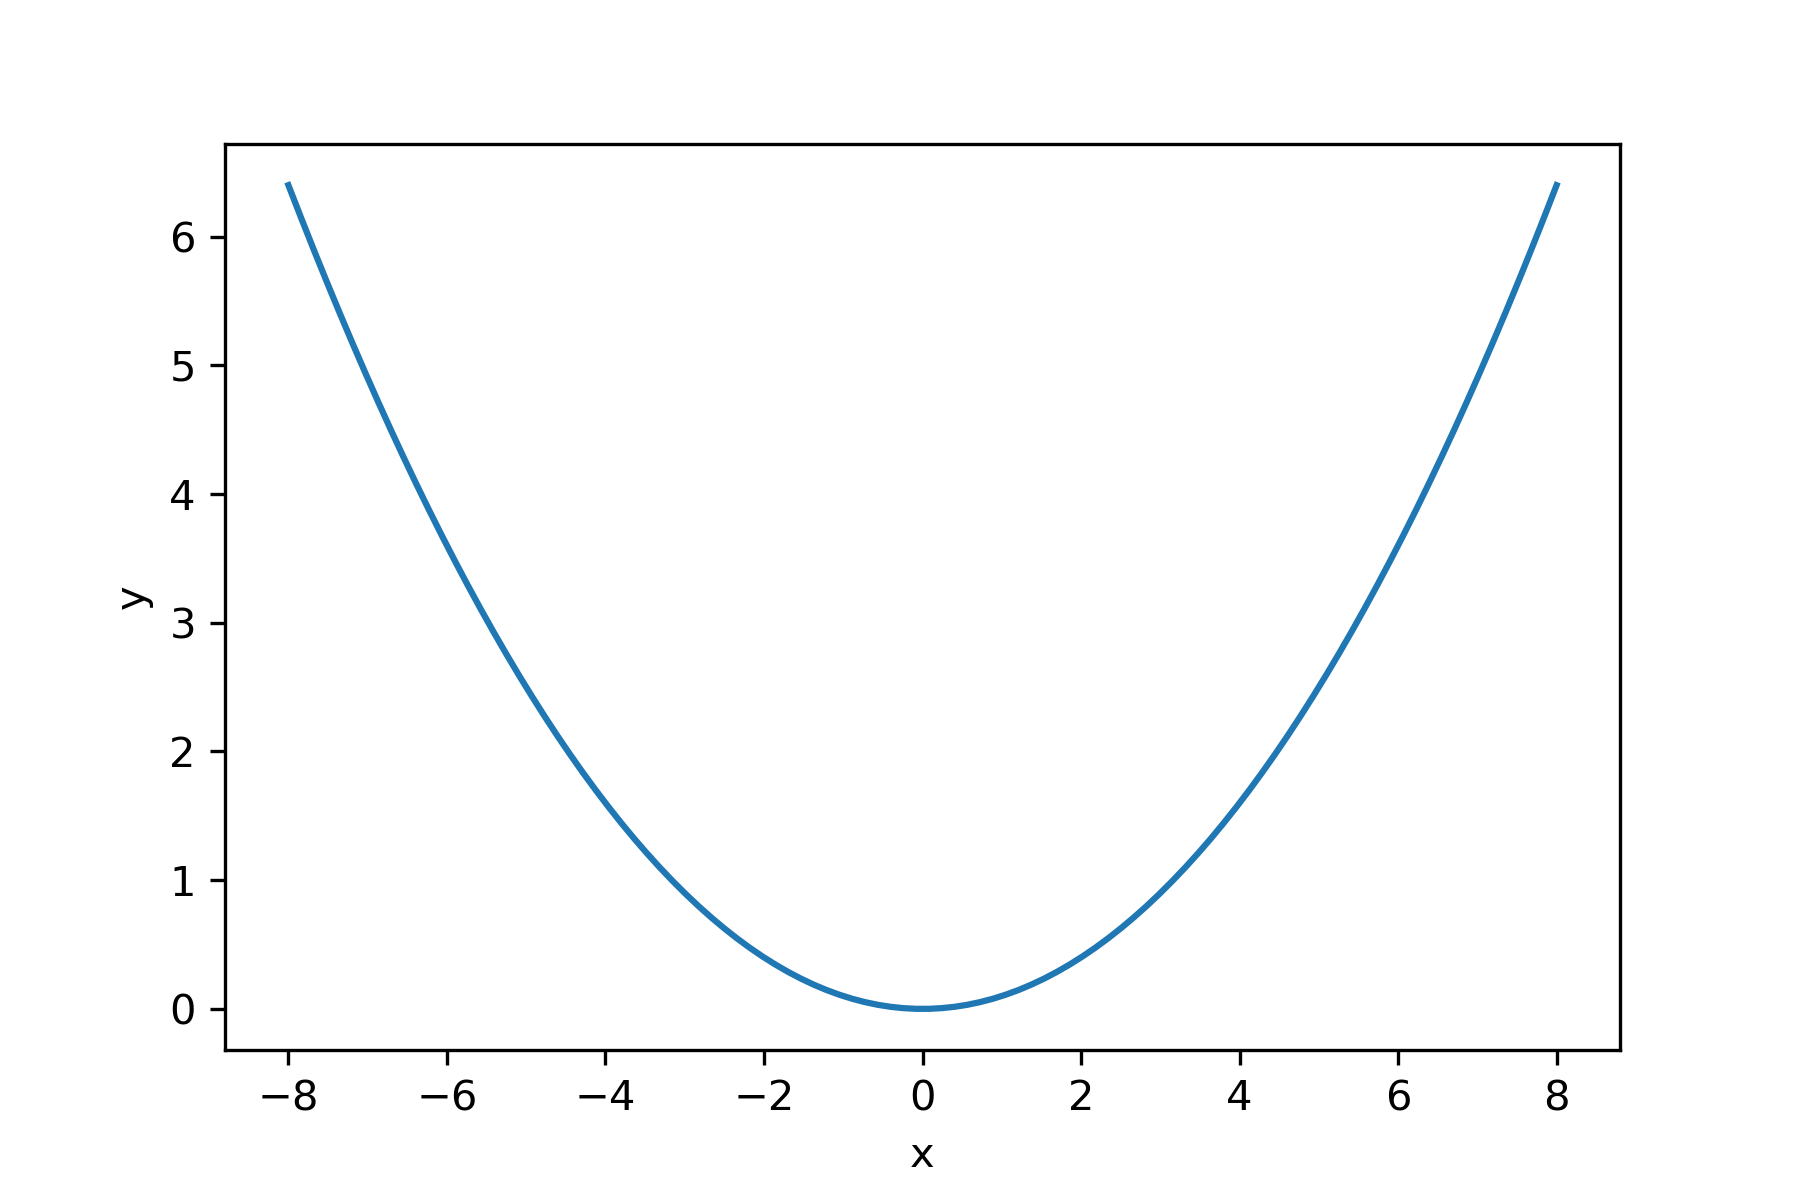
y=0.1*x**2
plt.plot(x,y)
plt.xlabel('x')
plt.ylabel('y')
plt.show()
This Python script will generate a graph of a quadratic function
(1) 
The graph is shown below.
Now, let us save this graph as a PNG image file. To save the graph as an image in Python, we use the function matplotlib.pyplot.savefig(). This function has a number of input arguments. However, we in practice use only two input arguments. The first input argument is the file name with the extension of the file. This input argument is set as a Python string. For example, if we want to save the graph as a PNG file called “graph1”, the file name should be “graph1.png”. The second input argument is the resolution of the saved image. The resolution is specified by the input parameter “dpi”, which an abbreviation for DPI- Dots Per Inch. For example, if we want to save a graph as an image with the resolution of 300 DPI, then we need to set “dpi=300”. Other input parameters or arguments of the function matplotlib.pyplot.savefig() are given in the Matplotlib documentation webpage.
The complete call of the function matplotlib.pyplot.savefig() is
plt.savefig('graph1.png', dpi=300)The complete Python script for generating the graph and saving the graph as a PNG file is given below.
plt.plot(x,y)
plt.xlabel('x')
plt.ylabel('y')
plt.savefig('graph1.png', dpi=300)
plt.show()
We can also change the type of the saved file by simply changing the extension. For example, if we want to save the graph as a JPG image file, we type
plt.plot(x,y)
plt.xlabel('x')
plt.ylabel('y')
plt.savefig('graph1.jpg', dpi=300)
plt.show()
On the other hand, to save the graph in Python as a PDF file, we type
plt.plot(x,y)
plt.xlabel('x')
plt.ylabel('y')
plt.savefig('graph1.pdf', dpi=300)
plt.show()
We can also save the graph in Python as a PS file, by changing the extension of the file
# generate a basic plot
plt.plot(x,y)
plt.xlabel('x')
plt.ylabel('y')
plt.savefig('graph1.ps', dpi=300)
plt.show()