 by
by
In this probability, statistics, and Python tutorial, we explain how to model the binomial distribution in Python by using the SciPy library and its Statistical Function module called “stats”. In particular, in this tutorial, we explain
- How to create a binomial distribution in Python.
- How to create a probability mass function of the binomial distribution in Python.
- How to compute the moments (mean, variance, skewness, and kurtosis) of the binomial distribution in Python.
- How to generate a plot of the probability mass function of the binomial distribution in Python.
- How to compute the percentiles of the binomial distribution in Python.
By the end of this statistics tutorial, you will be able to generate a graph of the probability mass function of the binomial distribution. The graph is given below.
The YouTube tutorial accompanying this webpage is given below.
Summary of the Binomial Distribution
The Binomial distribution is a very important statistical distribution. For example, this distribution is used to model the process of tossing a coin  number of times. In every random experiment of tossing a coin, there is a probability of
  of obtaining the head, and the probability of
  of obtaining the tail. If the coin is fair, then the probability of two outcomes is equal, and
  . The Binomial distribution provides us with the probability of obtaining
  heads in number of trials. For example, it can provide us with an answer to the following problem:
Suppose that a fair coin is tossed 10 times. What is the probability of obtaining 3 heads?
The experiments can look like this
Experiment 1: HHTTHTHTHT
Experiment 2: THTHHHTHTH
Experiment 3: THTHHHTHTH
….
where “H” is used to denote the head of the coin and “T” is used to denote the tail of the coin.
To answer this and similar types of questions, we need to mathematically describe the Binomial distribution. Let us formally define the Binomial distribution and its probability mass function. We are considering a random experiment where there are two outcomes called success and failure. In a single experiment, the probability of success is and the probability of failure is . We are performing a random experiment consecutive times. Formally speaking, the binomial distribution is mathematically described by the probability mass function
(1) 
where
- is the total number of random independent experiments (random trials).
- is the probability of success in a single experiment
- is the total number of successes in independent experiments (random trials).
 is the probability of obtaining successes in independent experiments.
- The notation
(2)

is the binomial coefficient. The binomial coefficient is often pronounced as “n choose k”.
How to Define Binomial Distribution in Python and SciPy
To define the binomial distribution in Python, we use the SciPy library and its statistical function module called “stats”. The Python script below computes the probability mass function of the binomial distribution for  , , and
  . That is, the Python script below computes the probability of obtaining exactly one head in one random trial of tossing a fair coin.
import numpy as np
from scipy.stats import binom

# let us verify the Binomial distribution for a single experiment

n1=1
p1=0.5
k1=0

# get the probability mass function (pmf)
binom.pmf(k1,n1,p1)
First, we import the NumPy library. Then, from sicpy.stats we import the binomial distribution that is denoted by binom. We set the values for , , and , and we compute the probability mass function (pmf) by using the function binom.pmf(). The input arguments of the function “binom.pmf()” are , , and respectively.
Now let us go back to our original problem of computing the probability of obtaining 3 heads in 10 trials of tossing a fair coin. In this case,  ,
,  , and . The Python script below computes the probability mass function for this case\
# now let us solve the problem of computing the probability
# of obtaining 3 heads in 10 trials of tossing a fair coin
n2=10
p2=0.5
k2=3

binom.pmf(k2,n2,p2)
The resulting probability is very low. It is only equal to 0.1171875 . In the previous two examples, we computed the values of the probability mass function of the binomial distribution for a specific value of . However, we can compute the values of the probability mass function for many different values of . The following script demonstrates how to do that
n3=20
p3=0.5

# create an array of k values
kValues=np.arange(n3+1)

# create an array of probabilities (pmf values) for given kValues
pmfValues=binom.pmf(kValues,n3,p3)
The function binom.pmf() also accepts in its first input an array of values. The function returns an array of probability mass function values for specified values.
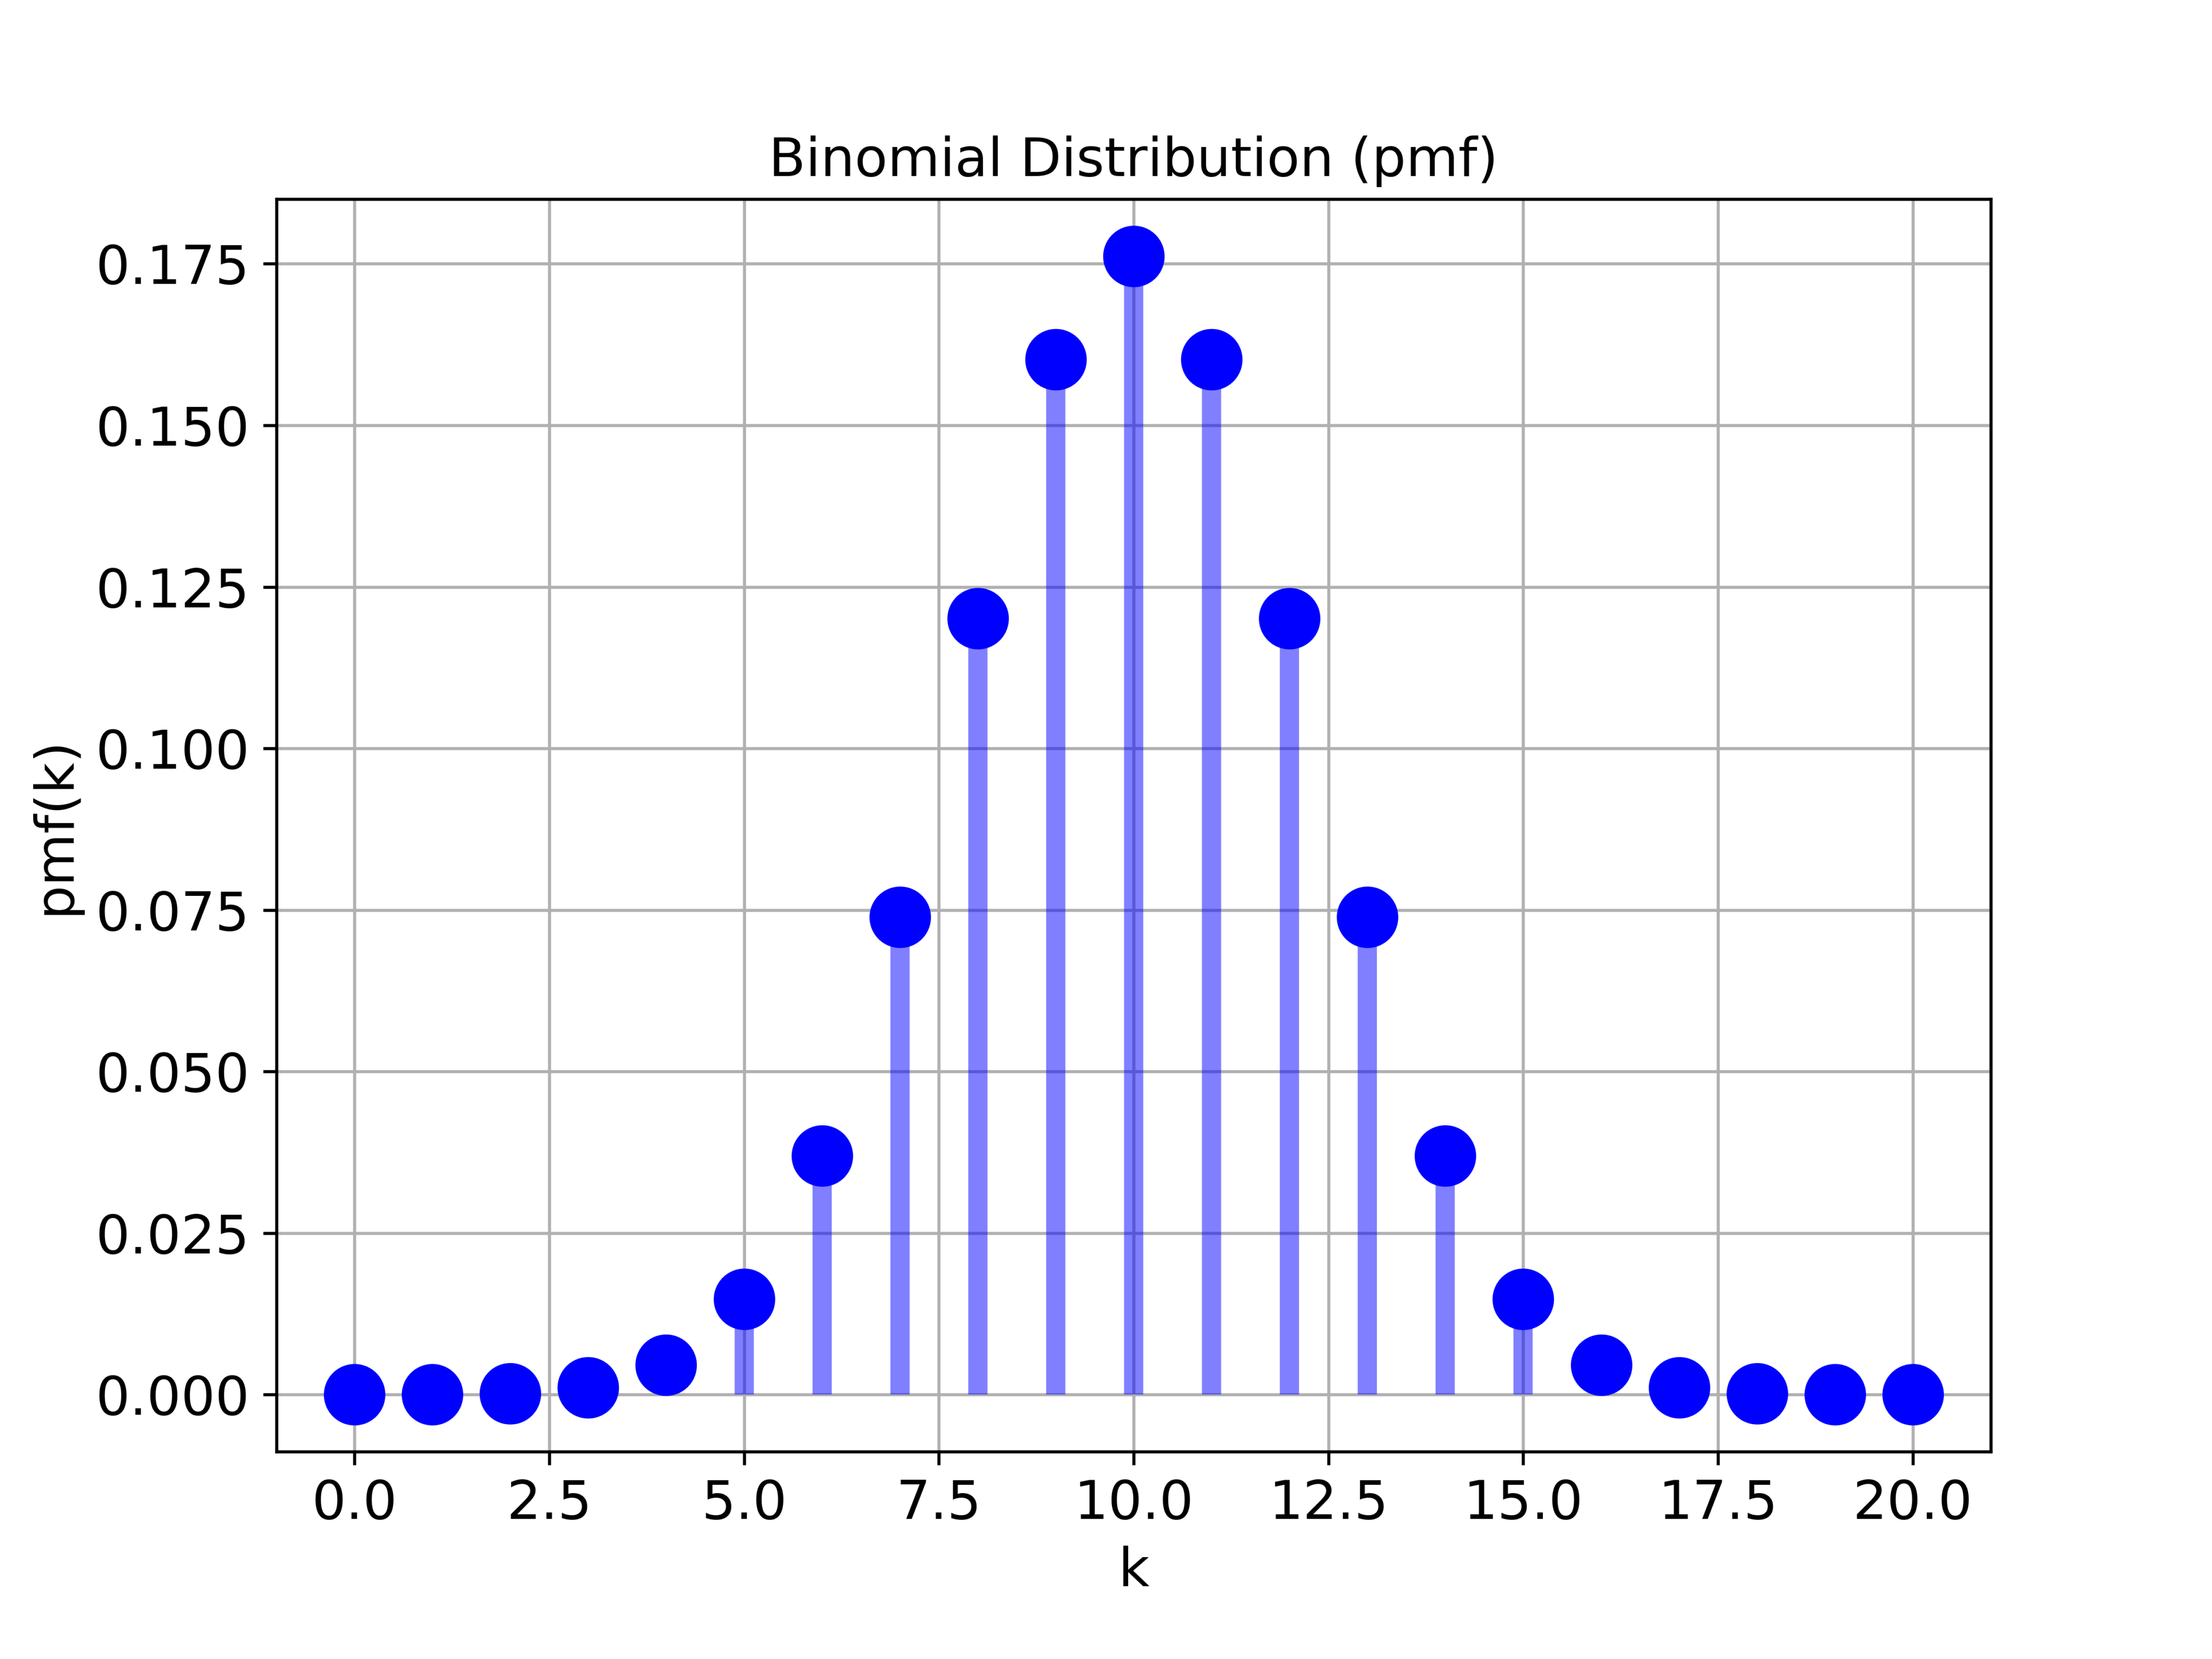
How to Plot Probability Mass Function of Binomial Distribution in Python
The Python script given below generates a plot of the probability mass function of the binomial distribution.
# let us now visualize the binomial distribution

n3=20
p3=0.5

# create an array of k values
kValues=np.arange(n3+1)

# create an array of probabilities (pmf values) for given kValues
pmfValues=binom.pmf(kValues,n3,p3)

# check the sum, the sum should be 1
sum(pmfValues)

# plot the binomial distribution's pmf
plt.figure(figsize=(8,6))
plt.plot(kValues,pmfValues,'bo',ms=15)
plt.vlines(kValues, 0, pmfValues, colors='b', lw=5, alpha=0.5)
plt.title('Binomial Distribution (pmf)', fontsize=14)
plt.xlabel('k', fontsize=14)
plt.ylabel('pmf(k)',fontsize=14)
plt.tick_params(axis='both',which='major',labelsize=14)
plt.grid(visible=True)
plt.savefig('binomialPmf.png',dpi=600)
plt.show()
The generated graph is shown in the figure below.
 and .
and .How to Compute the Percentiles of the Binomial Distribution in Python
To compute the percentiles of the Binomial distribution in Python we use the function “binom.ppf()”.
# compute percentiles
binom.ppf(0.05, n3, p3)

binom.ppf(0.5, n3, p3)

binom.ppf(0.95, n3, p3)
How to Compute the First Four Moments (Mean, Variance, Skewness, and Kurtosis) of the Binomial Distribution in Python
The Python script given below computes the first four moments of the Binomial distribution
# compute the first four moments
meanVal, varVal, skewVal, kurtVal = binom.stats(n3, p3, moments='mvsk')
To compute the mean, variance, skewness, and kurtosis of the binomial distribution, we use the function “binom.stats”. The keyword moments=’mvsk’, means that we want to compute Mean, Variance, Skewness, and Kurtosis.
How to Compute the Most Likely Outcome of Random Experiment Described by Binomial Distribution
To compute the most likely outcome of the random experiment described by the binomial distribution, we use the following Python script.
# most likely value of k
binom.pmf(kValues,n3,p3).argmax()
# probability
binom.pmf(kValues,n3,p3).max()