 by
by
In this post, we explain how to compute and how to plot MACD (Moving Average Convergence/Divergence) of Stock Price Time Series in Pandas and Python. This parameter is important for generating the buy/sell signals of stocks, see for example the Wikipedia page. The video accompanying this post is given below.
In the previous post, we have explained how to compute an exponential moving average of time series. In this post, we are going to use this knowledge to define and compute the MACD indicator. Let  , be a time series, and let EMA
 denote the Exponential Moving Average (EMA) of the time series series with the period of
  . Then MACD indicator is defined by:
(1) 
where
 is the short period and
  is a long period of the corresponding exponential moving averages.
The signal or the average of the MACD indicator is defined by the exponential moving average of MACD with the period of  . That is,
(2) 
Finally, the MACD bars are defined as the difference between the MACD and EMA :
:
(3) 
Compactly, the MACD indicators are collectively denoted by MACD . Let us now explain the Python code for computing and for plotting these indicators. First, we specify the parameters and download the stock data. Except for the parameter definitions for computing EMAs, the following block lines are identical to the codes used in our previous post. Consequently, we will not present additional comments about the code used to download the data. We download the SPY stock historical data:
“SPY tracks a market-cap-weighted index of US large- and midcap stocks selected by the S&P Committee.”
Taken from RobinHood brokerage account.
# -*- coding: utf-8 -*-
"""
Moving Average Convergence/Divergence (MACD) of Stock Prices

https://en.wikipedia.org/wiki/MACD

Author:
    Aleksandar Haber

Date: January 27, 2021
Some parts of this code are inspired by the following sources:

-- https://en.wikipedia.org/wiki/MACD
-- https://pandas.pydata.org/pandas-docs/stable/reference/api/pandas.DataFrame.ewm.html
-- "Learn Algorithmic Trading: Build and deploy algorithmic trading systems and strategies
using Python and advanced data analysis", by Sebastien Donadio and Sourav Ghosh
"""

"""
Definitions

    -- MACD:

            MACD is the difference between a fast (short period) exponential moving average and
            a slow (long-period) exponential moving average of time series.

    -- Signal or average:

            Signal or average is an exponential moving average of the computed MACD.

    -- Divergence (histograms or bars):

            Difference between the MACD and signal.

Usual notation:

    MACD(a,b,c)

    -- a - short period

    -- b - long period

    -- c - signal period

    commonly used values:

    MACD(12,26,9), that is a=12, b=26, and c=9

"""

# standard imports
import pandas as pd
import numpy as np
import matplotlib.pyplot as plt
# used to download the stock prices
import pandas_datareader as pdr


# MACD parameters
short_period = 12
long_period  = 26
signal_period = 9

# define the dates for downloading the data
startDate= '2020-01-01'
endDate= '2021-01-28'

# Read about Python pickle file format:  https://www.datacamp.com/community/tutorials/pickle-python-tutorial
fileName = 'downloadedData.pkl'

stock_symbol='SPY'

# this piece of code either reads the data from the saved file or if the saved file does not exist
# it downloads the data

try:
    data=pd.read_pickle(fileName)
    print('Loading the data from the local disk.')
except FileNotFoundError:
    print('The data is not found on the local disk.')
    print('Downloading the data from Yahoo.')
    data = pdr.get_data_yahoo(stock_symbol,start=startDate,end=endDate)
    # save the data to file
    print('Saving the data to the local disk.')
    data.to_pickle(fileName)

# inspect the data

data.head()

data['Adj Close'].plot()

# isolate the closing price
closingPrice = data['Adj Close']
The following code lines are used to compute the short and long EMAs, MACD, and signal. The code is self-explanatory (see our previous post for the explanation)
ewm_short=data['Adj Close'].ewm(span=short_period, adjust=False).mean()
ewm_long=data['Adj Close'].ewm(span=long_period, adjust=False).mean()
MACD=ewm_short-ewm_long
signal_MACD=MACD.ewm(span=signal_period, adjust=False).mean()
bars=MACD-signal_MACD
bar_values=bars.values
bar_index_number=np.arange(0,len(bar_values))
The following code lines are used to plot the indicators.
with plt.style.context('ggplot'):
import matplotlib
font = { 'weight' : 'bold',
'size' : 14}
matplotlib.rc('font', **font)
fig = plt.figure(figsize=(20,20))
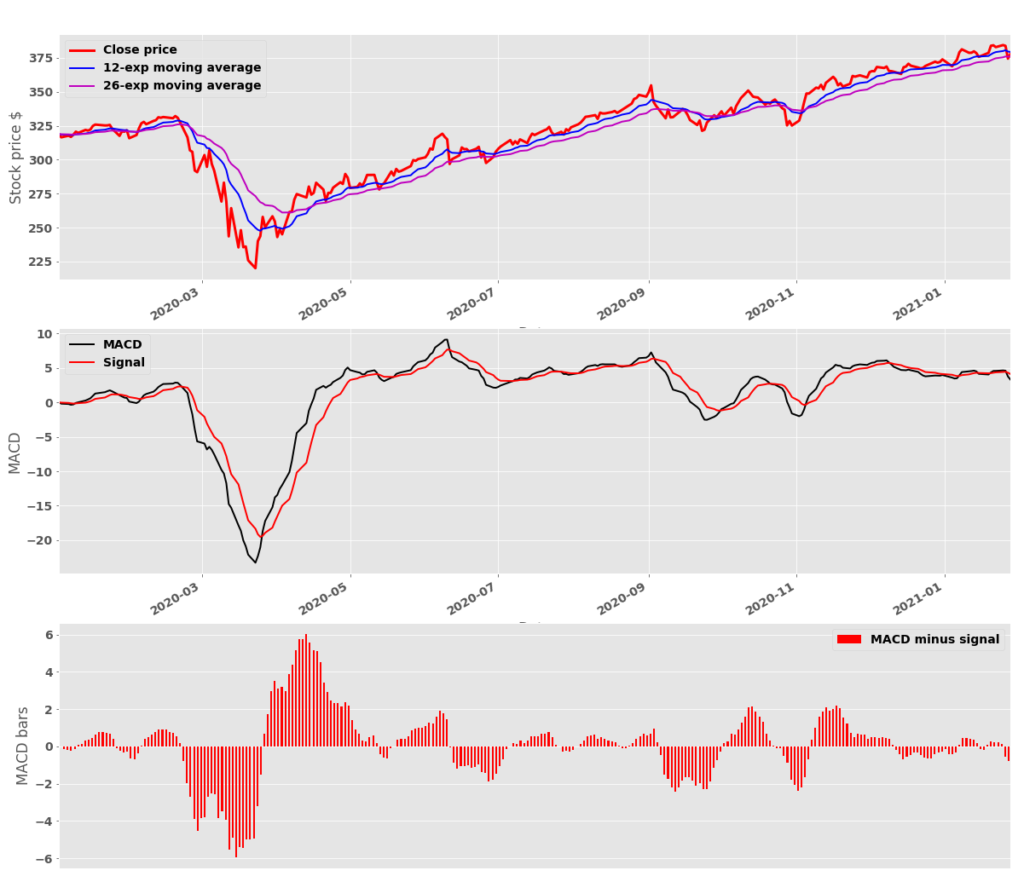
ax1=fig.add_subplot(311, ylabel='Stock price $')
data['Adj Close'].plot(ax=ax1,color='r',lw=3,label='Close price',legend=True)
ewm_short.plot(ax=ax1,color='b',lw=2,label=str(short_period)+'-exp moving average',legend=True)
ewm_long.plot(ax=ax1,color='m',lw=2,label=str(long_period)+'-exp moving average',legend=True)
ax2=fig.add_subplot(312, ylabel='MACD')
MACD.plot(ax=ax2,color='k',lw=2,label='MACD',legend=True)
signal_MACD.plot(ax=ax2,color='r',lw=2,label='Signal',legend=True)
ax3=fig.add_subplot(313, ylabel='MACD bars')
x_axis = ax3.axes.get_xaxis()
x_axis.set_visible(False)
bars.plot(ax=ax3,color='r', kind='bar',label='MACD minus signal', legend=True,use_index=False)
plt.savefig('MACD_spy.png')
plt.show()
The results are shown in the following figure.
This is the end of this post. We have learned how to compute the MACD indicators that are very important for algorithmic trading.