 by
by In this Matplotlib and Python tutorial, we thoroughly explain how to draw rectangles in Python and how to adjust the rectangle properties, such as transparency, face color, edge color, hatch, and other visual properties. The YouTube tutorial accompanying this webpage tutorial is given below.
How to Draw Rectangles in Python
In Python, we draw geometrical shapes such as rectangles, circles, polygons, etc, by using patches. Patches are primitive shapes that are defined by the Matplotlib library.
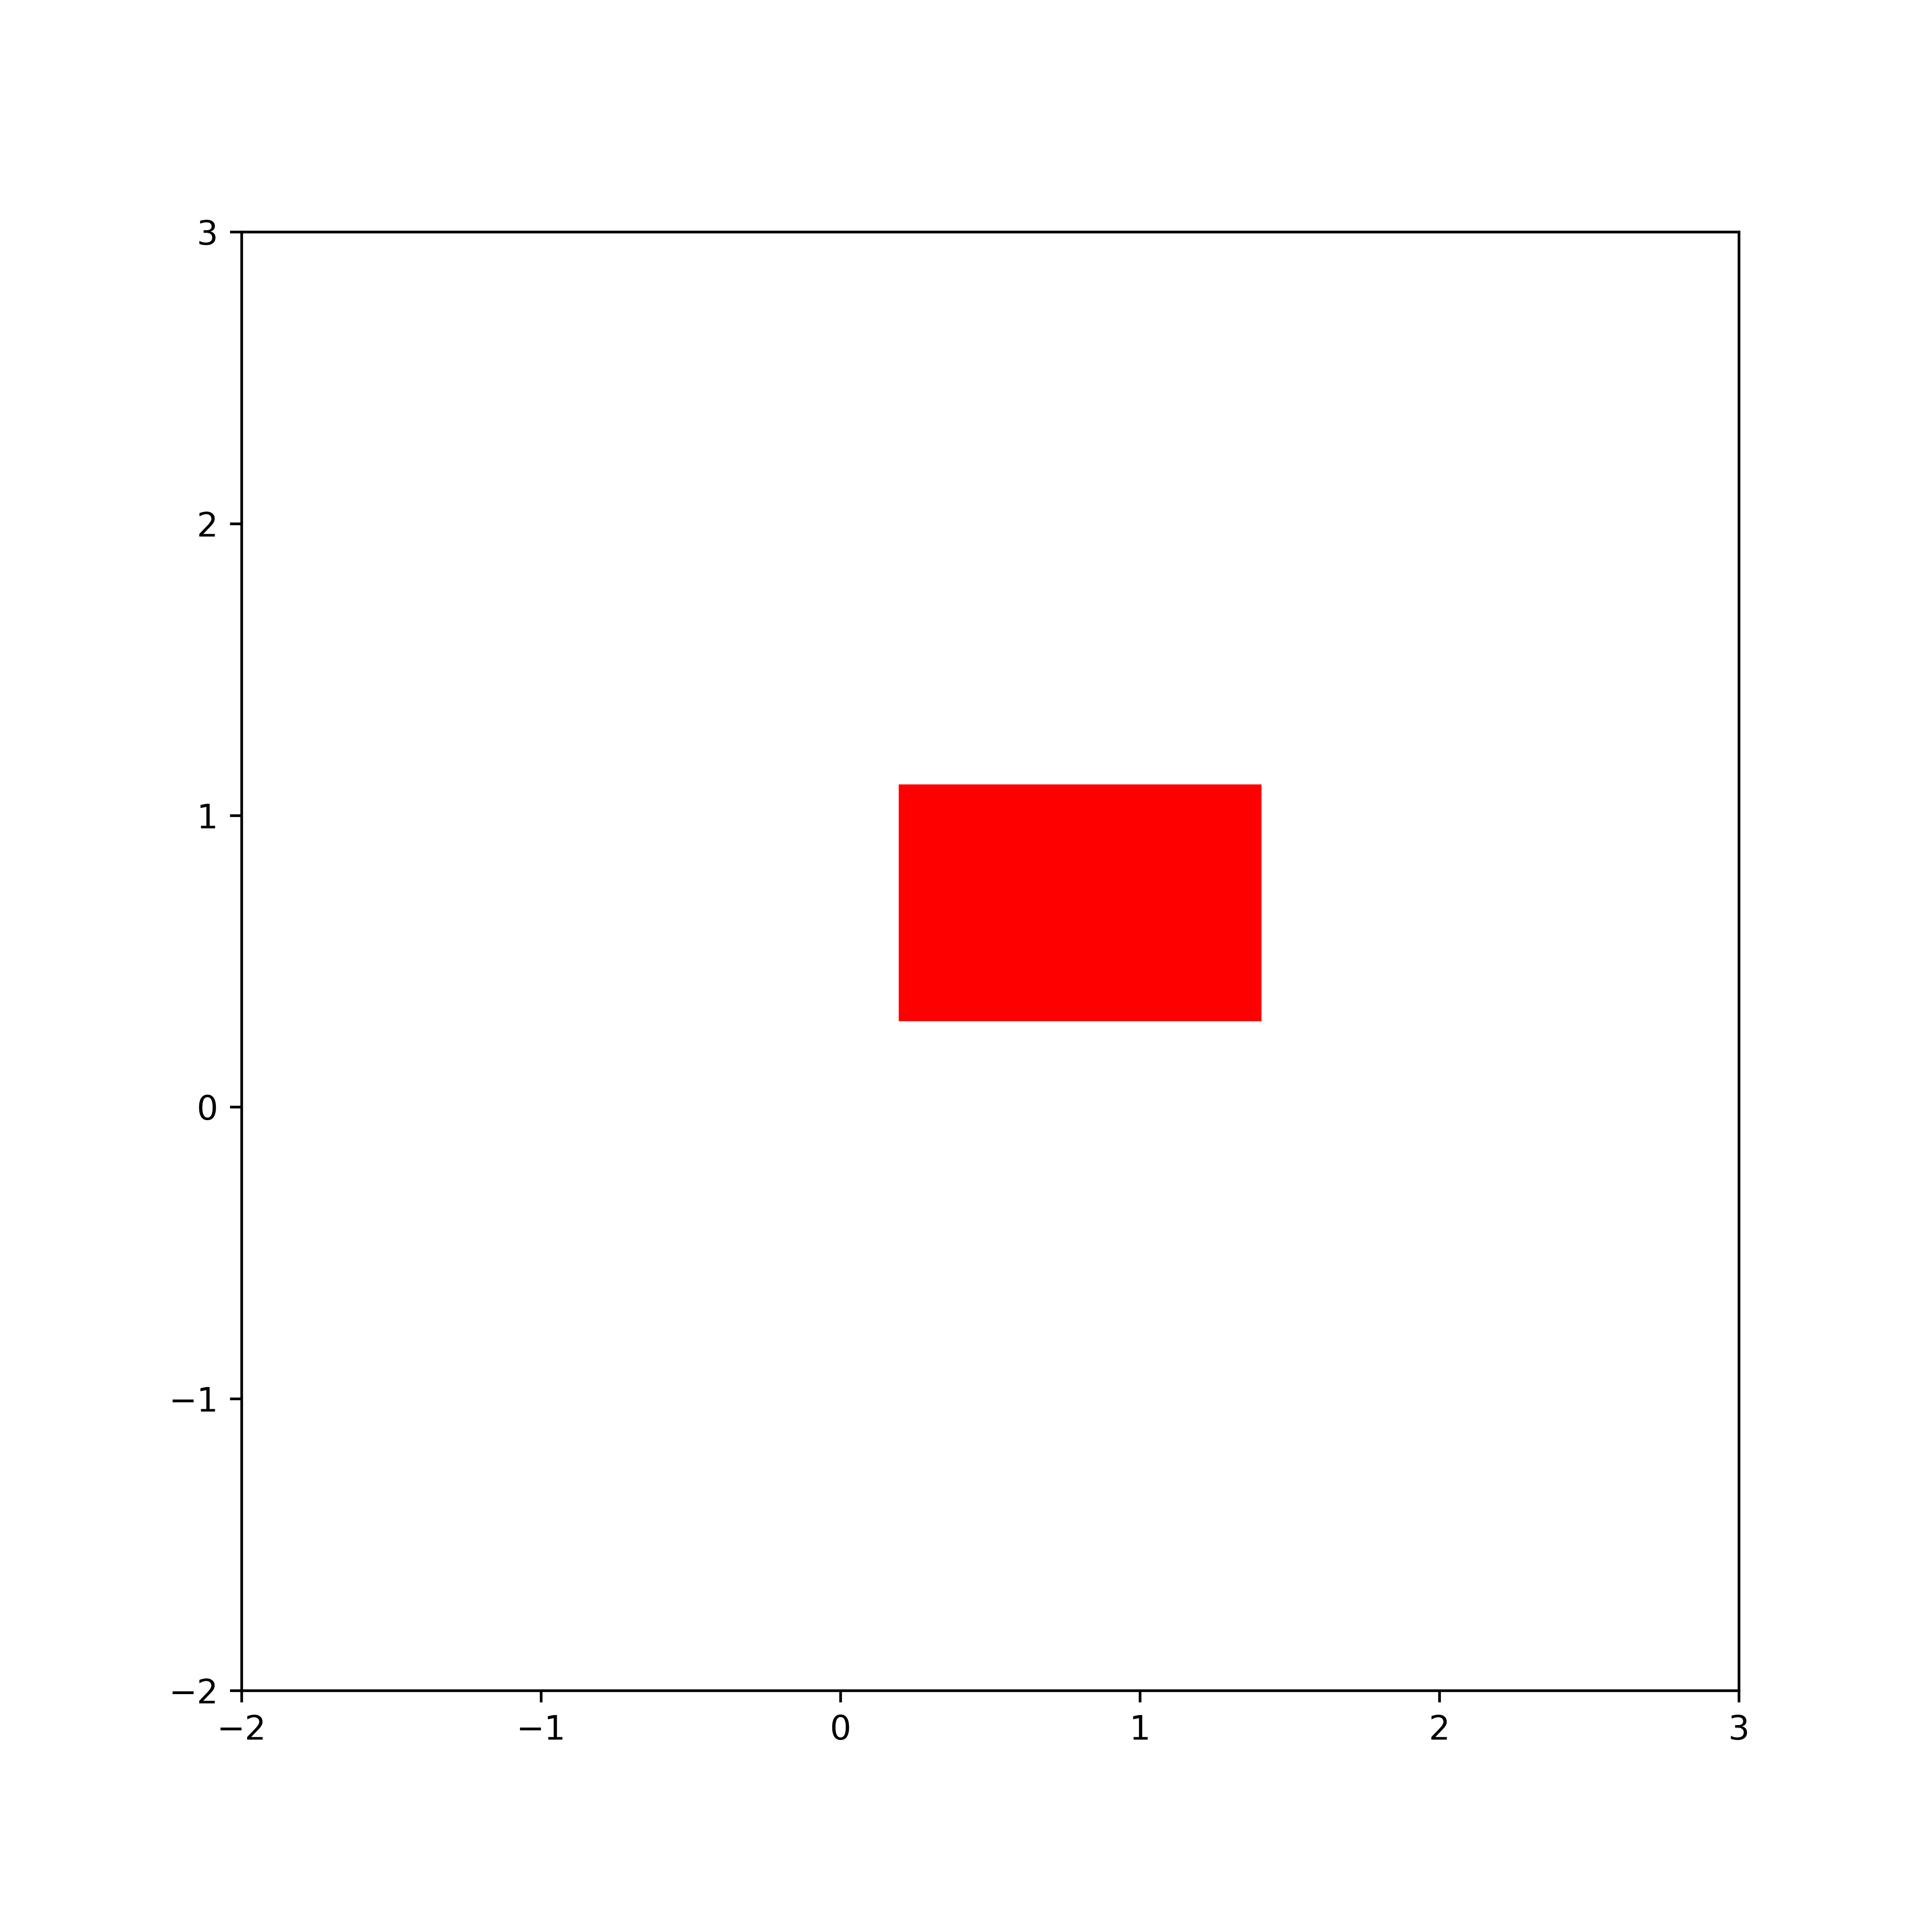
To create and draw a rectangle in Python, we first need to create a rectangle patch object, and then we need to add the created rectangle to the Axes object. A rectangle is defined by the coordinates of its bottom left corner point, width, and height. The Python script given below creates and draws a rectangle.
import matplotlib.pyplot as plt

plt.figure(figsize=(8,8))
# we draw a rectangle by specifying the bottom left corner point, width and height
# we need to create a patch
# the class is matplotlib.patches.Rectangle
rect1=plt.Rectangle(xy=(0.2,0.3), width=1.2, height=0.8, color='r' )
# get the current figure
fig = plt.gcf()
# get the current Axes instance
ax = fig.gca()
# add the patch to the Axes
ax.add_patch(rect1)
# set the figure limits
plt.xlim([-2,3])
plt.ylim([-2,3])
# save the figure
plt.savefig('rectangle1.png',dpi=600)
# show the figure
plt.show()
We create a patch object representing the rectangle by using the function
rect1=plt.Rectangle(xy=(0.2,0.3), width=1.2, height=0.8, color='r' )“xy” specifies the coordinates of the bottom left corner of the rectangle, and the other keyword arguments specify the width and height. To get a reference to the current figure, we use “plt.gcf()”. To get a reference to the Axes object of the current figure, we use “fig.gca()”. We add the created rectangle patch to the current Axes (current figure), by using
ax.add_patch(rect1)After that we set the figure axis limits, and save and show the figure. The figure is shown below.
How to Draw a Rectangle Without a Fill Color (Face Color) and Only With Edge Line in Python and Matplotlb
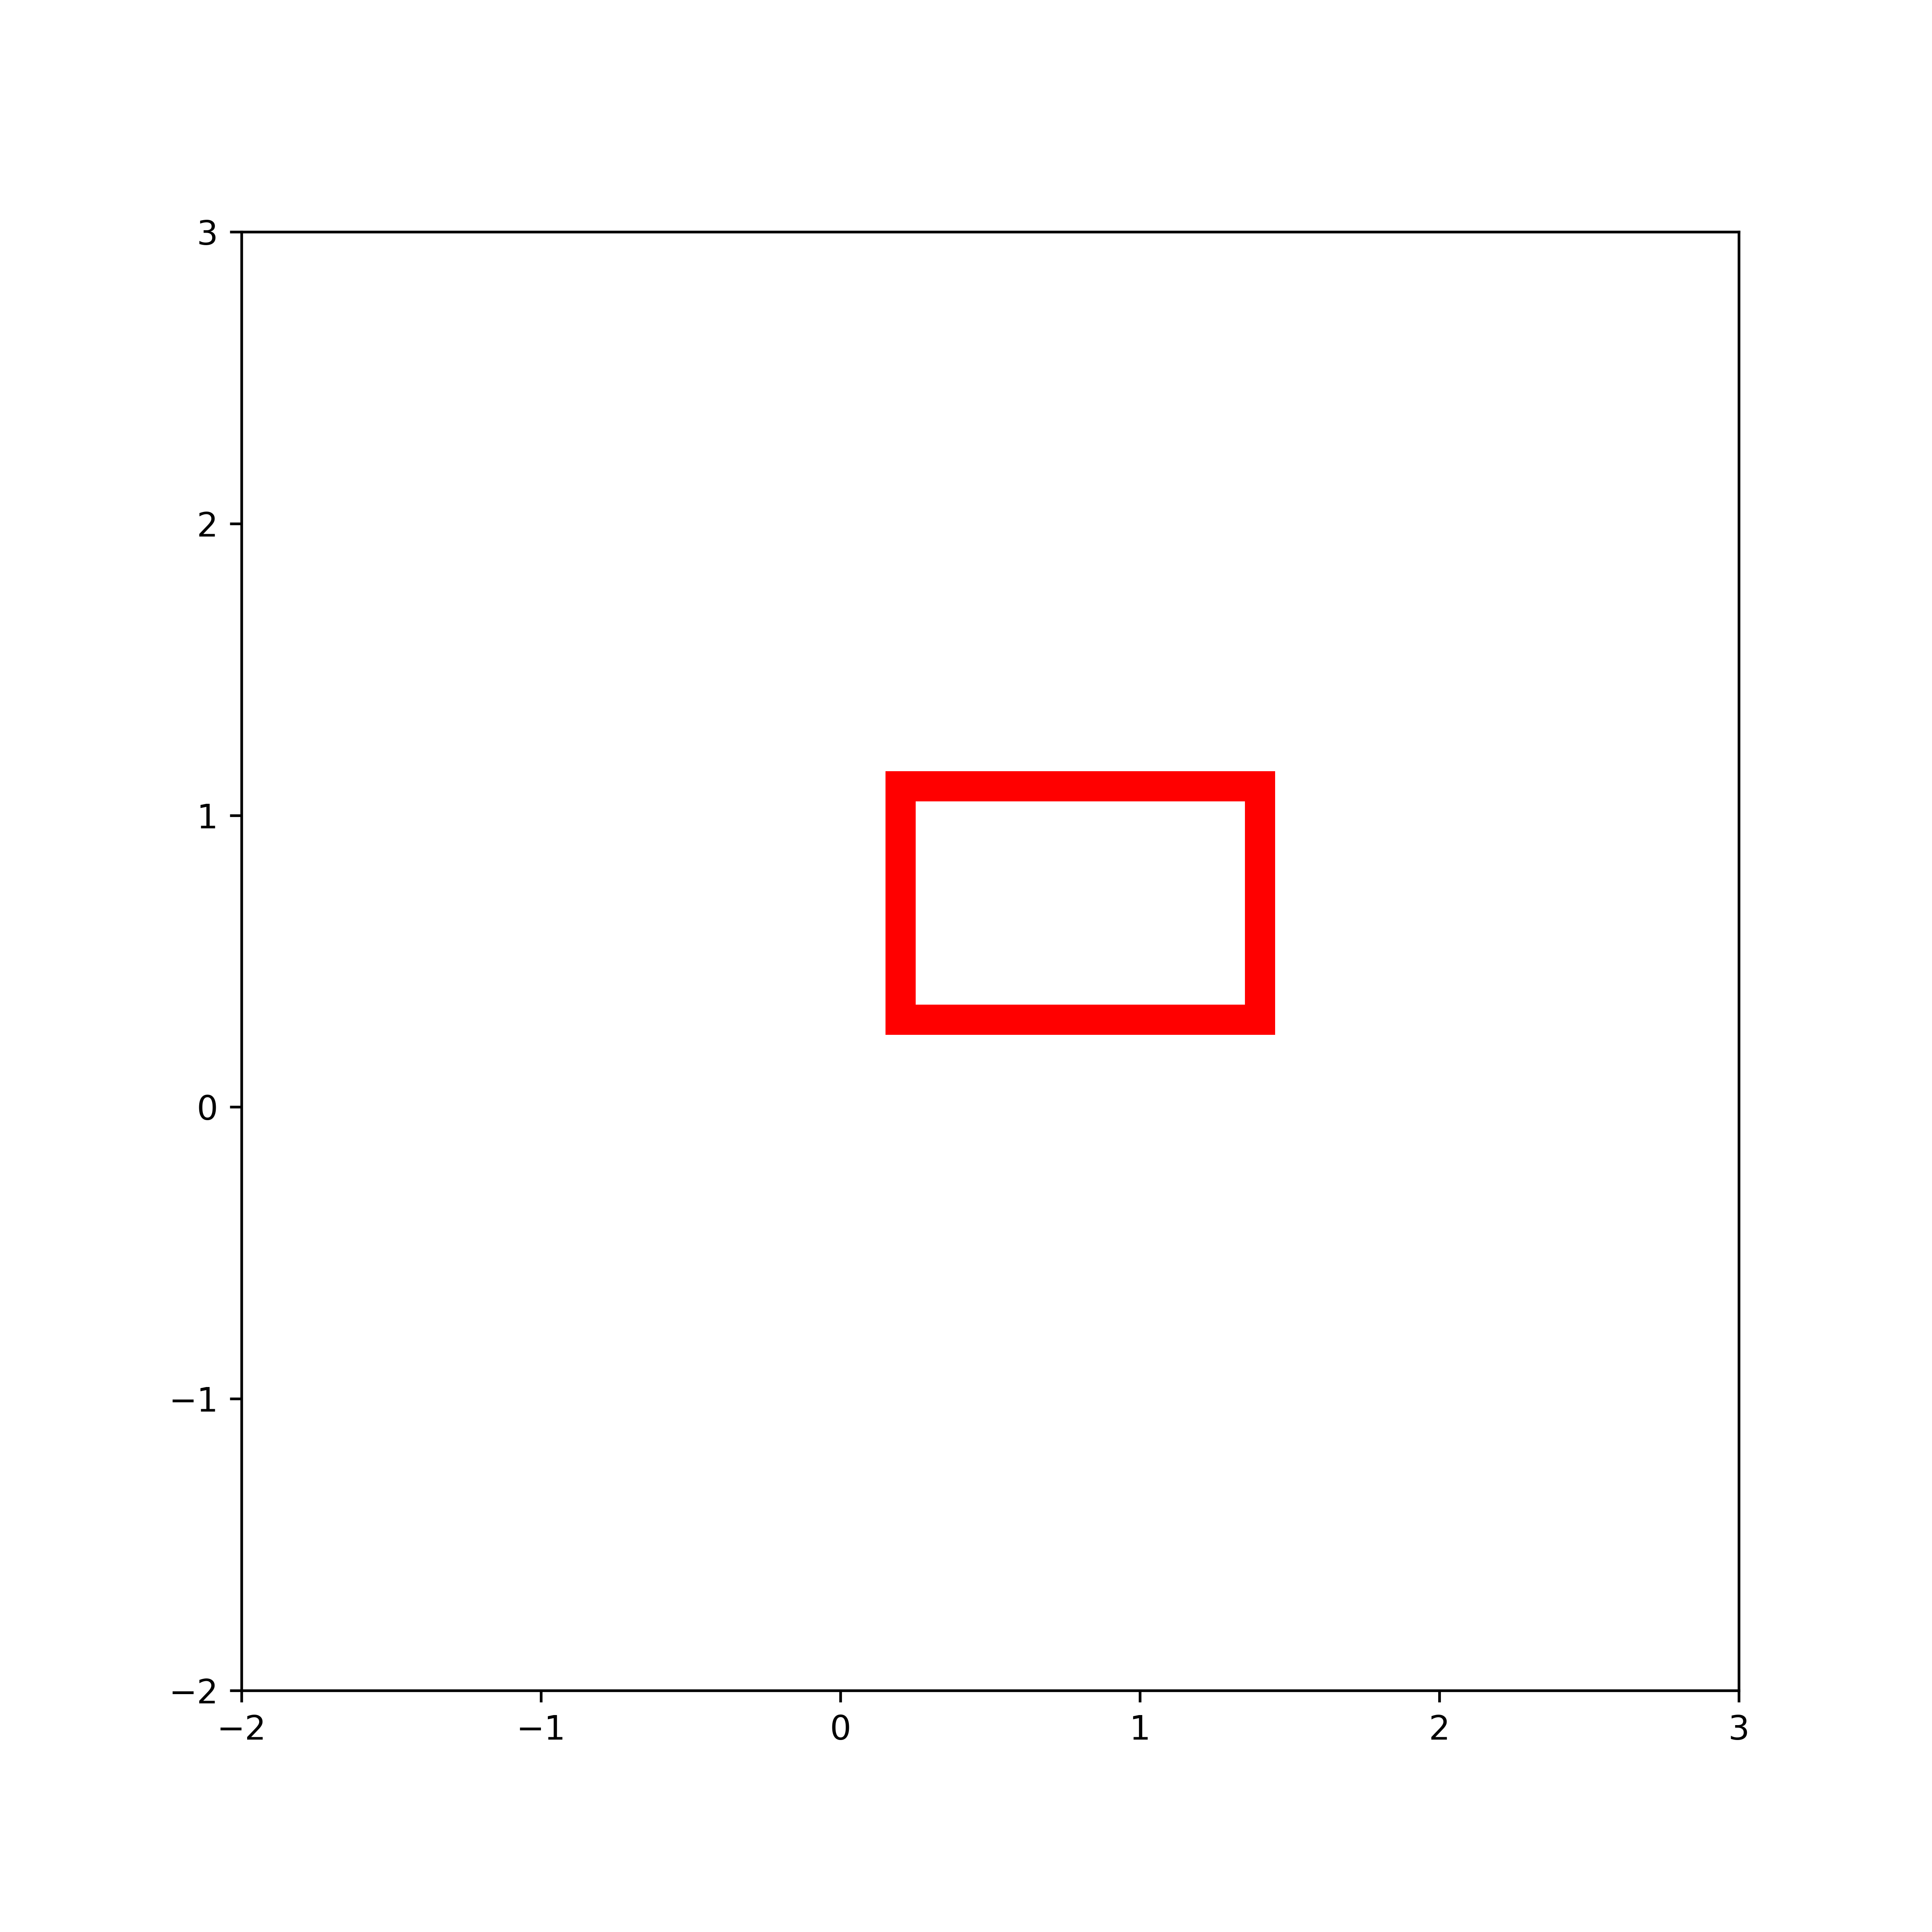
Here, we explain how to draw a rectangle without a face fill, and only with an edge line in Python.
import matplotlib.pyplot as plt

plt.figure(figsize=(8,8))
# we draw a rectangle by specifying the bottom left corner point, width and height
# we need to create a patch
# the class is matplotlib.patches.Rectangle
rect1=plt.Rectangle(xy=(0.2,0.3), width=1.2, height=0.8, color='r',
                    fill=False, linewidth=9)
# get the current figure
fig = plt.gcf()
# get the current Axes instance
ax = fig.gca()
# add the patch to the Axes
ax.add_patch(rect1)
# set the figure limits
plt.xlim([-2,3])
plt.ylim([-2,3])
# save the figure
plt.savefig('rectangle1.png',dpi=600)
# show the figure
plt.show()
We control the rectangle fill by using the keyword argument “fill”. It can be True or False. If we specify the rectangle without a fill, we need to specify the line width of the edge line. We do that by using the keyword argument “linewidth”. The rectangle is shown in the figure below.
How to Draw Rectangles with Specific Face and Edge Colors in Python and Matplotlib
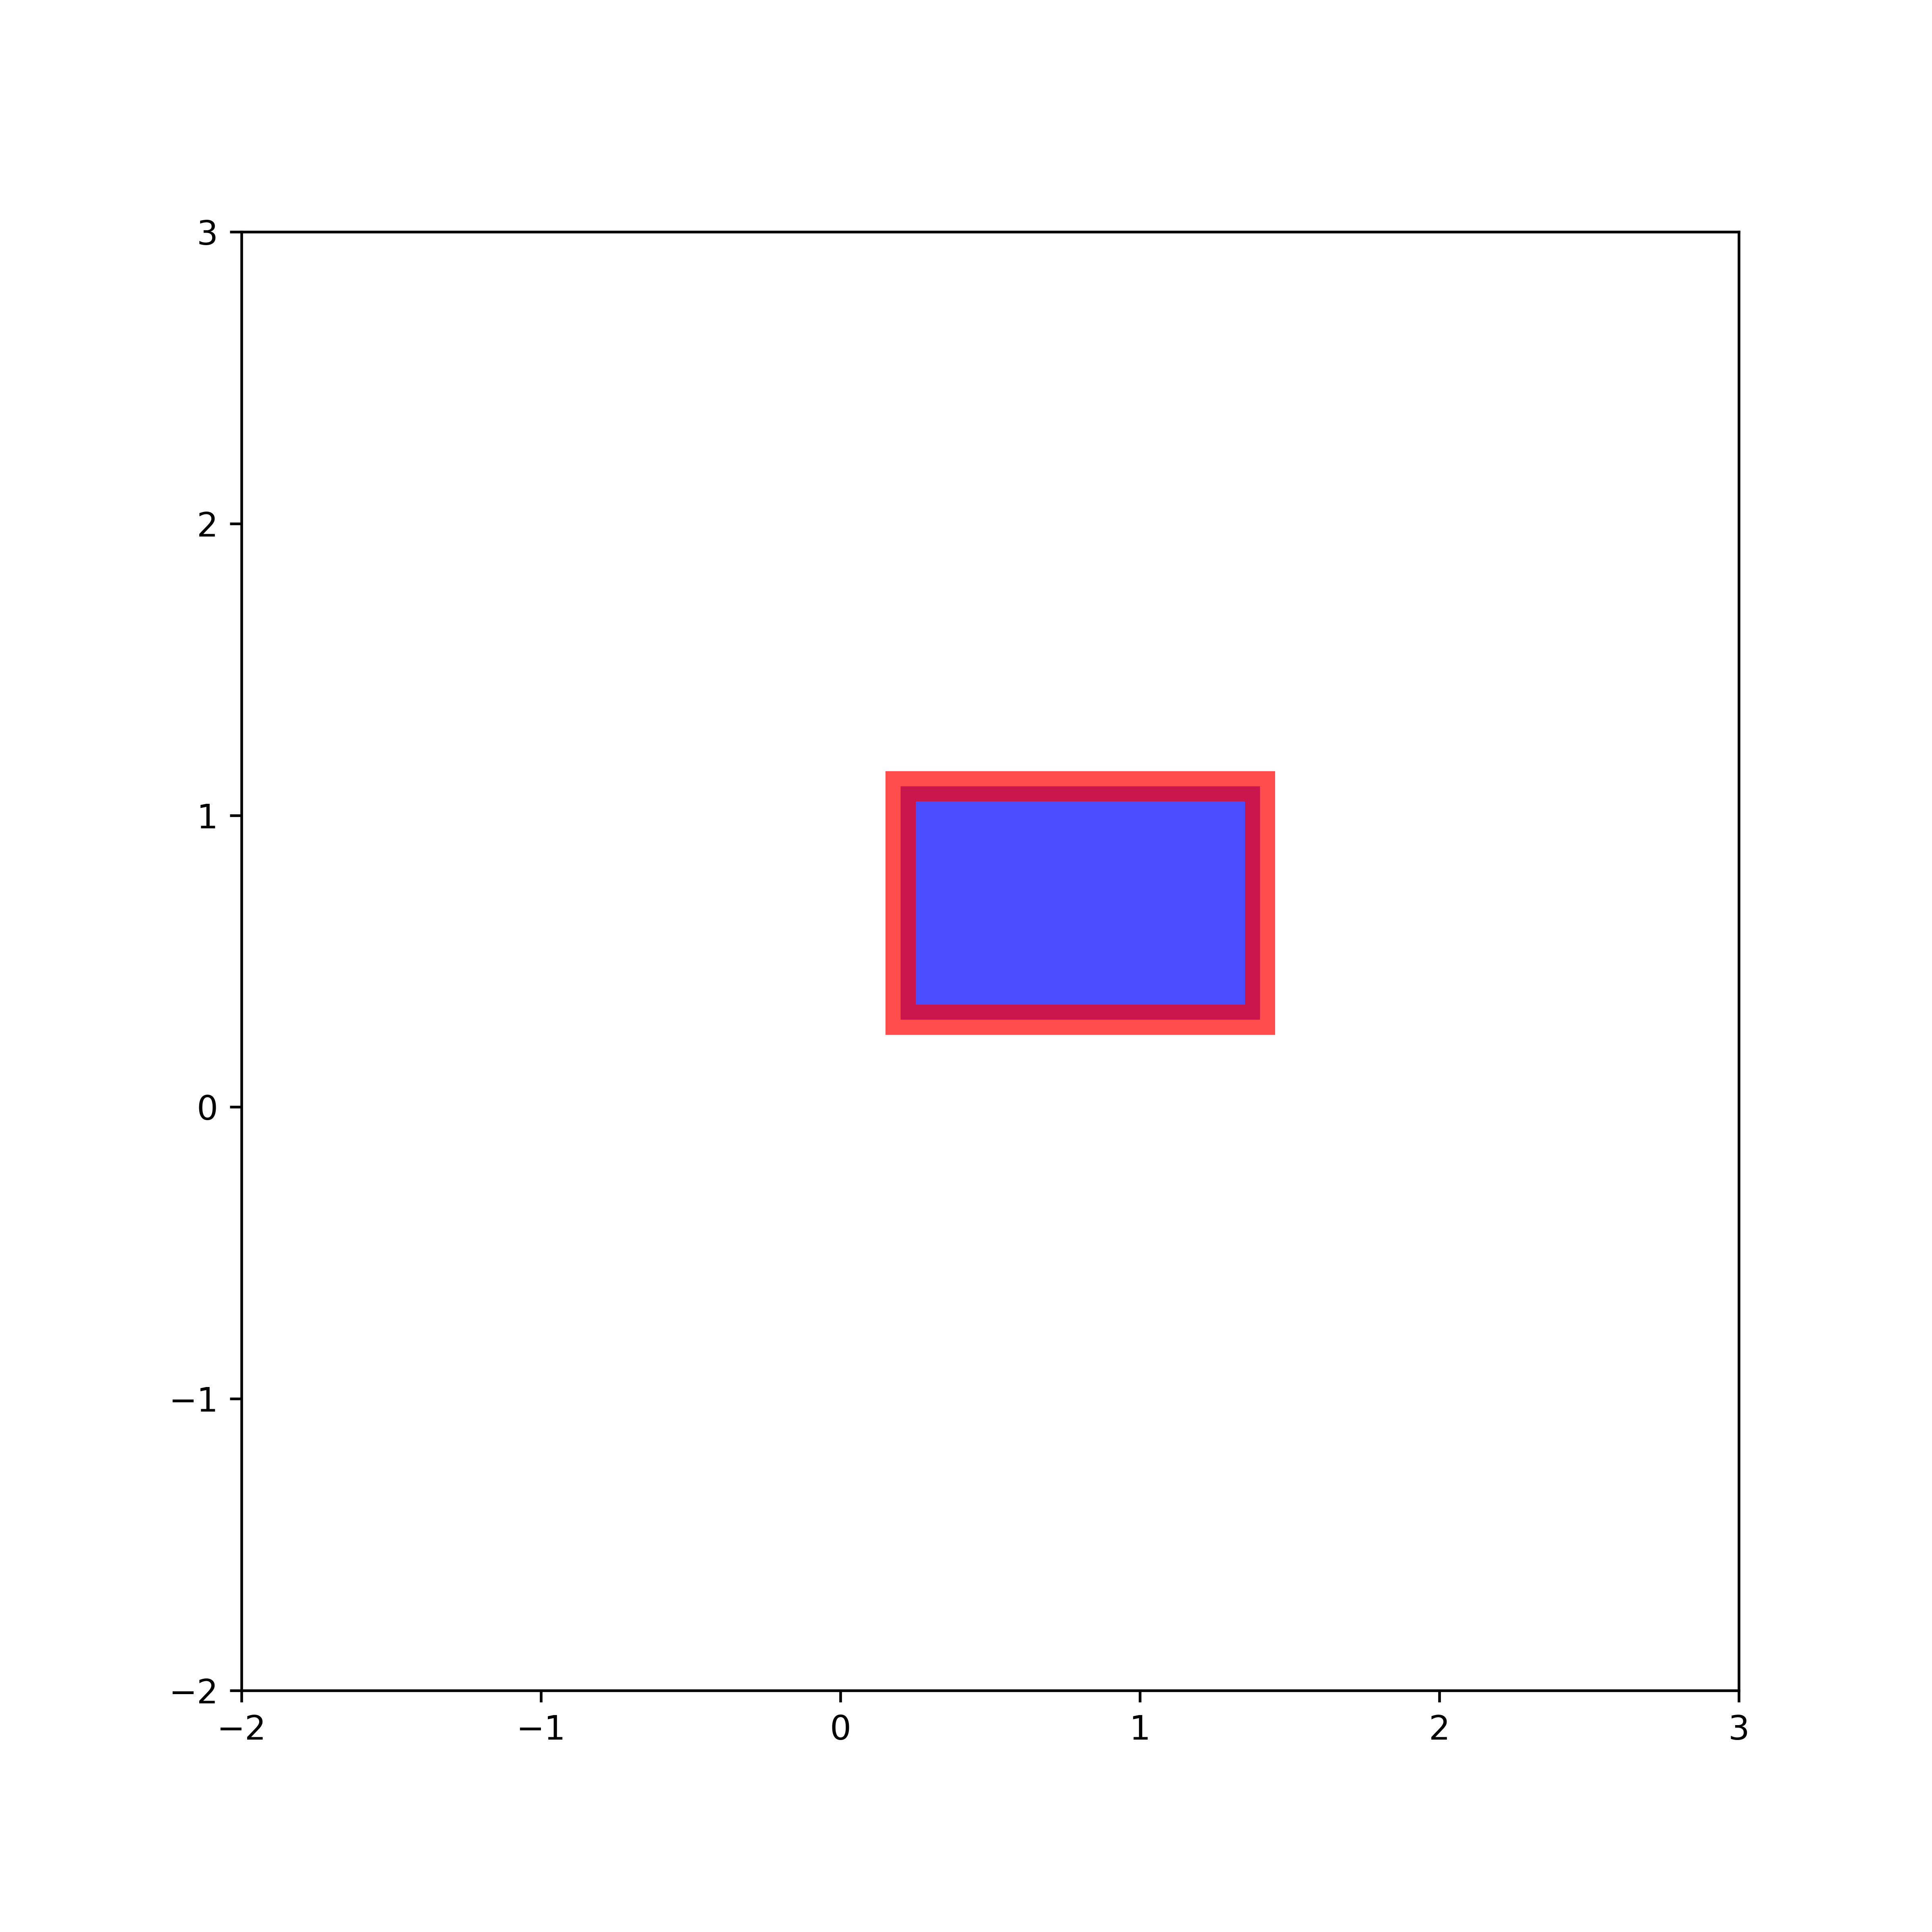
Here, we explain how to draw rectangles with predefined face and edge colors in Python. The Python script is given below.
import matplotlib.pyplot as plt

plt.figure(figsize=(8,8))
# we draw a rectangle by specifying the bottom left corner point, width and height
# we need to create a patch
# the class is matplotlib.patches.Rectangle
rect1=plt.Rectangle(xy=(0.2,0.3), width=1.2, height=0.8,
                    edgecolor='r', facecolor='b', alpha=0.7, linewidth=9)
# get the current figure
fig = plt.gcf()
# get the current Axes instance
ax = fig.gca()
# add the patch to the Axes
ax.add_patch(rect1)
# set the figure limits
plt.xlim([-2,3])
plt.ylim([-2,3])
# save the figure
plt.savefig('rectangle1.png',dpi=600)
# show the figure
plt.show()
To control the face and edge colors, we use the keyword arguments “edgecolor” and “facecolor”. We control the transparency of the rectangle by using the argument “alpha” which is in the interval from 0 (completely transparent) to 1 (not transparent). The rectangle is shown in the figure below.
How to Draw Rectangles With Hatch in Python and Matplotlib
The Python script given below draws a circle with a face filled with a hatch pattern.
import matplotlib.pyplot as plt

plt.figure(figsize=(8,8))
# we draw a rectangle by specifying the bottom left corner point, width and height
# we need to create a patch
# the class is matplotlib.patches.Rectangle

# hatch
# #  '/', '\', '|', '-', '+', 'x', 'o', 'O', '.', '*'
rect1=plt.Rectangle(xy=(0.2,0.3), width=1.2, height=0.8,
                    facecolor='r', hatch='/', linewidth=5)
# get the current figure
fig = plt.gcf()
# get the current Axes instance
ax = fig.gca()
# add the patch to the Axes
ax.add_patch(rect1)
# set the figure limits
plt.xlim([-2,3])
plt.ylim([-2,3])
# save the figure
plt.savefig('rectangle4.png',dpi=600)
# show the figure
plt.show()
We specify the hatch by using the keyword argument “hatch”. We can use the following characters for the hatch pattern: “‘/’, ‘\’, ‘|’, ‘-‘, ‘+’, ‘x’, ‘o’, ‘O’, ‘.’, ‘*’ “. The image is shown below.
