by
by In this Python and OpenCV tutorial, we explain how to draw rectangles. We explain how to draw both filled rectangles and rectangles with only boundary lines. In addition to this, we explain how to generate a drawing canvas in Python represented by an image with a desired background color and how to save the image with drawn rectangles as PNG or JPG files. The YouTube Tutorial accompanying this post is given below.
How to Draw a Rectangle in OpenCV
Before we explain how to draw a rectangle in OpenCV and Python, we first need to explain the orientation of coordinate systems in OpenCV. The figure below shows the orientation of the coordinate system.
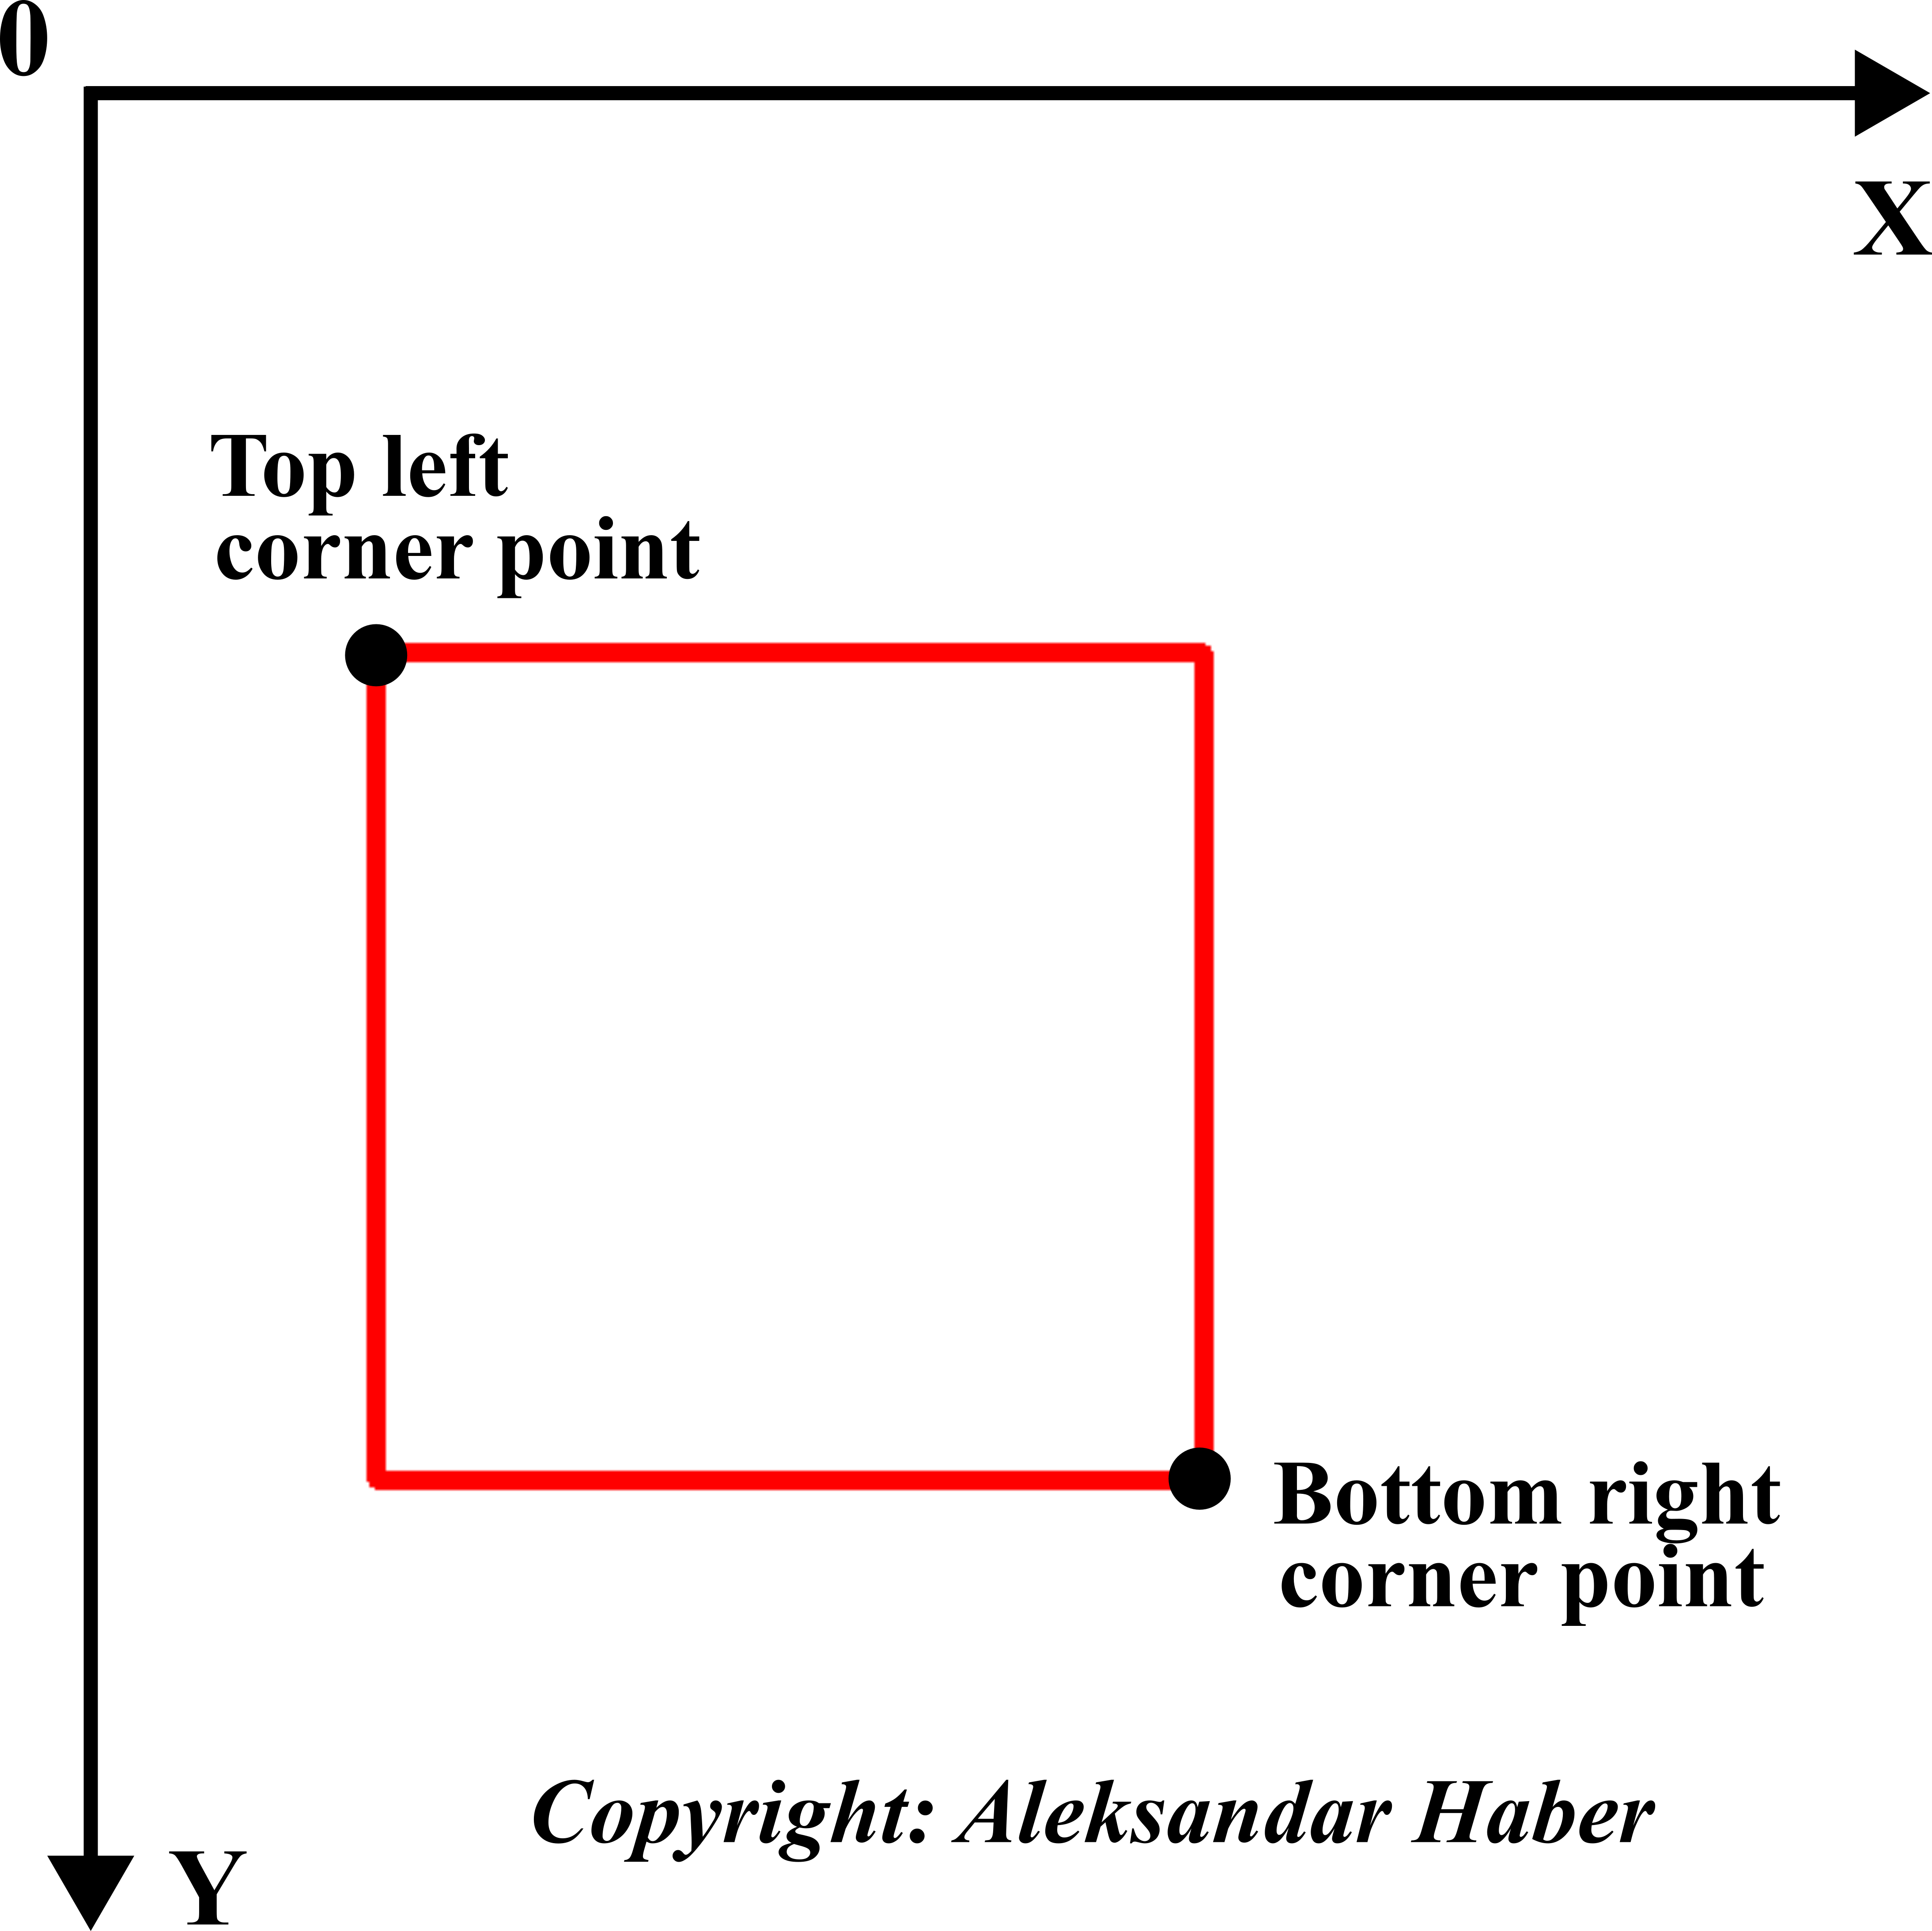
This figure shows the orientation and position of the x and y Cartesian axes. Rectangles in OpenCV are defined by two points: top-left corner point and the bottom-right corner point. The Python script given below creates an empty image with a white background and draws a rectangle.
import numpy as np
import cv2


# create an image with a white background that serves as a drawing canvas

# set the width and height of the image
heightImage=600
widthImage=600

# a new image with a white background
# BGR (255,255,255)
newImageWhite = np.zeros((heightImage,widthImage,3),np.uint8)
# blue channel
newImageWhite[:,:,0]=255
# green channel
newImageWhite[:,:,1]=255
# red channel
newImageWhite[:,:,2]=255

# show the empty image
#cv2.imshow("White Image",newImageWhite)
#cv2.waitKey(0)
#cv2.destroyAllWindows()

# first let us draw a rectangle with only a boundary
#  The rectangle is specified by two points:
# Point at the top left corner
# Point at the bottom right corner

# (x coordinate, y coordinate)
topLeftCornerPoint =(100,200)
bottomRightCornerPoint =(400,500)

# boundary line color of the rectangle
# red color
colorLine=(0,0,255)

# thickness of the boundary line
lineThickness=5


cv2.rectangle(newImageWhite,topLeftCornerPoint,
             bottomRightCornerPoint,
             colorLine,lineThickness)
First, we import the necessary libraries: NumPy and OpenCV. Note that OpenCV is imported as cv2. Then, we define a NumPy array of zeros representing the image. This NumPy array represents the image. The images in cv2 are represented as NumPy arrays with the following dimensions (image height, image width, 3 color channels). The three color channels are blue, green, and red. This is the so-called BGR (Blue-Green-Red) color model. The BGR color channels are coded by the tuple (B,G,R), where every entry of this tuple is of the type uint8 (8-bit unsigned integer). Consequently, every channel is coded by a positive integer from 0 to 255. The image created by
newImageWhite = np.zeros((heightImage,widthImage,3),np.uint8)
Has a black background. This is because the BGR color code (0,0,0) corresponds to the black color. By using
# a new image with a white background
# BGR (255,255,255)
newImageWhite = np.zeros((heightImage,widthImage,3),np.uint8)
# blue channel
newImageWhite[:,:,0]=255
# green channel
newImageWhite[:,:,1]=255
# red channel
newImageWhite[:,:,2]=255
we changed the background to a white color that is more suitable for the canvas on top of which we will draw rectangles.
The rectangle in OpenCV is created by using the function cv2.rectangle:
cv2.rectangle(newImageWhite,topLeftCornerPoint,
             bottomRightCornerPoint,
             colorLine,lineThickness)
This function has the following inputs
- The first input “newImageWhite” is the name of the image that serves as a canvas for creating rectangles.
- The second and third inputs called “topLeftCornerPoint” and “bottomRightCornerPoint” are the top left and bottom right corner points of the rectangle. They are defined as tuples of the form (x coordinate, y coordinate).
- The fourth input is the color of the boundary line expressed as the BGR color code. BGR color code is a tuple (blue color, green color, red color).
- The fifth argument is the boundary line thickness. In the example given above, we created a rectangle that is not filled. If we want to create a filled rectangle, we need to set lineThickness=-1.
After creating the rectangle, we display the image with the rectangle on the computer screen and we save the resulting image as a PNG image file. These steps are performed by using the script given below.
# show the image
cv2.imshow("White Image",newImageWhite)
cv2.waitKey(0)
cv2.destroyAllWindows()


# save image
cv2.imwrite("imageRect1.png",
            newImageWhite, [cv2.IMWRITE_PNG_COMPRESSION, 0])
These functions are explained in our previous tutorials, given here and here.
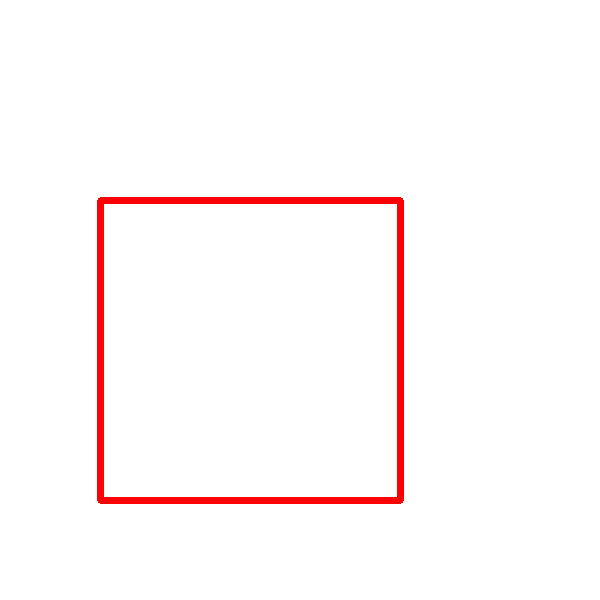
The image with the rectangle is given below.
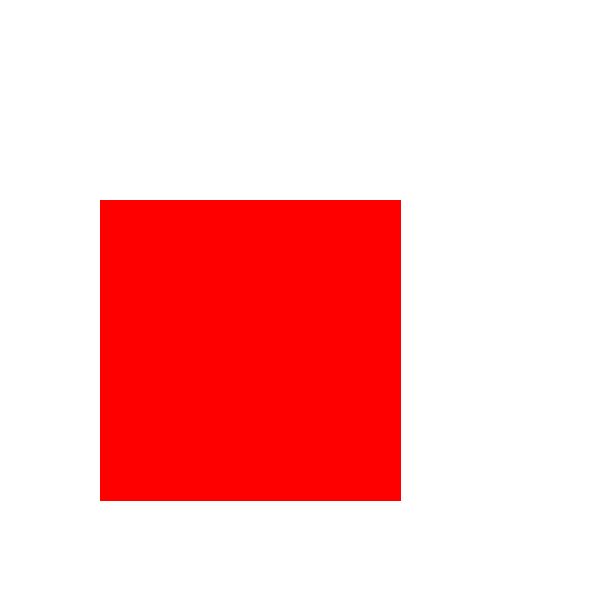
Next, we explain how to draw a completely filled rectangle in OpenCV and Python. This is achieved by using the script given below.
# import the necessary libraries

import numpy as np
import cv2


# create an image with a white background that serves as a drawing canvas

# set the width and height of the image
heightImage=600
widthImage=600

# a new image with a white background
# BGR (255,255,255)
newImageWhite = np.zeros((heightImage,widthImage,3),np.uint8)
# blue channel
newImageWhite[:,:,0]=255
# green channel
newImageWhite[:,:,1]=255
# red channel
newImageWhite[:,:,2]=255

# show the empty image
#cv2.imshow("White Image",newImageWhite)
#cv2.waitKey(0)
#cv2.destroyAllWindows()

# first let us draw a rectangle with only a boundary
#  The rectangle is specified by two points:
# Point at the top left corner
# Point at the bottom right corner

# (x coordinate, y coordinate)
topLeftCornerPoint =(100,200)
bottomRightCornerPoint =(400,500)

# boundary line color of the rectangle
# red color
colorLine=(0,0,255)

# thickness of the boundary line
lineThickness=5


cv2.rectangle(newImageWhite,topLeftCornerPoint,
             bottomRightCornerPoint,
             colorLine,-1)


# show the image
cv2.imshow("White Image",newImageWhite)
cv2.waitKey(0)
cv2.destroyAllWindows()


# save image
cv2.imwrite("imageRect2.png",
            newImageWhite, [cv2.IMWRITE_PNG_COMPRESSION, 0])
The only difference between this script and the previous Python script is in the last input argument of the function cv2.rectangle().
cv2.rectangle(newImageWhite,topLeftCornerPoint,
             bottomRightCornerPoint,
             colorLine,-1)
Instead of specifying the boundary line thickness as the last input argument, we set the last input argument to -1. This means that we want to plot a completely filled rectangle. The resulting rectangle is given in the figure below.