 by
by In this post, we explain how to create movies from images or matrices in MATLAB. The YouTube video accompanying this post is given below.
We create a movie from a series of images of a circle that is moving along the anti-diagonal of our screen. You can easily modify this code to generate any other trajectory of the circle or use other images to create a movie. The following MATLAB code creates images of circles with the centers that are displaced along the main anti-diagonal of our screen.
clear,pack,clc
sizeX=1000;
sizeY=1000;

radius=50;
[X,Y]=meshgrid(1:sizeX,1:sizeY);

centerXtrajectory=100:5:900;
centerYtrajectory=100:5:900;

for i=1:numel(centerXtrajectory)
pixelsInsideCircle=((X-centerXtrajectory(i)).^2+(Y-centerYtrajectory(i)).^2<=radius^2);
imageCircle{1,i}=(150-10)*pixelsInsideCircle;
imageCircle{1,i}=imageCircle{1,i}+10;
end
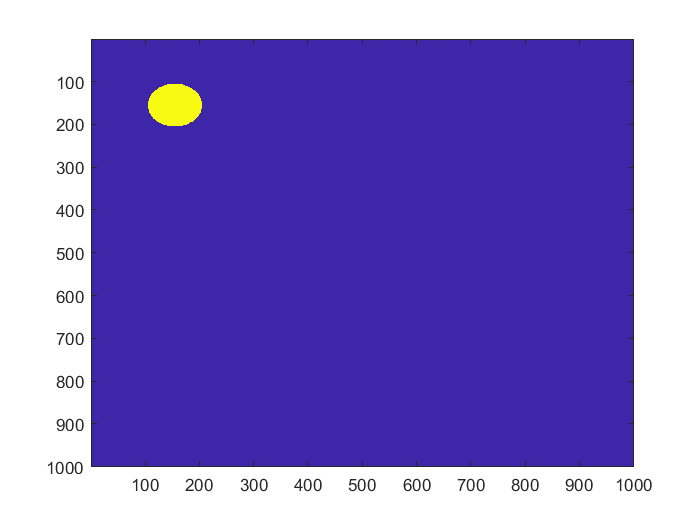
A few comments about this code are in order. The variables “sizeX” and “sizeY” define the screen size. The circle radius is defined on code line 5. The code line 6 is used to define a meshgrid matrices X and Y. If you are not familiar with MATLAB’s meshgrid function, you can find more information over here. Then the vectors “centerXtrajectory” and “centerYtrajectory” define x and y coordinates of the trajectory that the circle’s center should describe. The for loop defined on code lines 11-15 loops through the trajectory points and creates a series of images of circles with the centers placed on the trajectory. The code line 12 creates a binary matrix, where 0s correspond to the region outside of the circle, and 1s correspond to the region inside of the circle. Code lines 13 and 14 scale the pixel intensities of the regions such that we can nicely plot them. An example of the generated circle is shown in the figure below.
We can plot the generated images with pauses between the frames in order to create an impression of a movie. This can be achieved by using the following code lines.
for i=1:numel(centerXtrajectory)
   imagesc(imageCircle{1,i});
   pause(0.2)
end
Next, we create a movie from the series of generated images. We save the movie as an “avi” file. The following code lines are used to generate the movie.
map = colormap(cool);
movieObj = VideoWriter('video.avi','Indexed AVI');
movieObj.FrameRate = 25;
movieObj.Colormap = map;

open(movieObj);


 for i=1:numel(centerXtrajectory)
      writeVideo(movieObj, imageCircle{1,i});
 end

   close(movieObj);
   implay('video.avi');
A few comments about this code are in order. Code line 1 is used to define the color map. Different MATLAB colormaps can be found here. Basically, the colormap “map” has 256 rows and 3 columns. Every entry of our matrices ( that is either 10 or 150) will be represented by a color value stored in the “map” matrix. Code line 2 is used to create our movie object. Code line 3 is used to set the frame rate, and code line 4 is used to assign the colormap. The rest of the code is self-explanatory. We open the movie object, record the video in the for loop, close the movie object, and finally play the recorded movie.
The complete code is given below.
clear,pack,clc
sizeX=1000;
sizeY=1000;

radius=50;
[X,Y]=meshgrid(1:sizeX,1:sizeY);

centerXtrajectory=100:5:900;
centerYtrajectory=100:5:900;

for i=1:numel(centerXtrajectory)
pixelsInsideCircle=((X-centerXtrajectory(i)).^2+(Y-centerYtrajectory(i)).^2<=radius^2);
imageCircle{1,i}=(150-10)*pixelsInsideCircle;
imageCircle{1,i}=imageCircle{1,i}+10;
end

% for i=1:numel(centerXtrajectory)
%    imagesc(imageCircle{1,i});
%    pause(0.05)
% end


map = colormap(cool);
% other colormaps
%parula,turbo,hsv,hot,cool,spring,summer,autumn,winter,gray,bone,copper,pink,jet,lines

movieObj = VideoWriter('video.avi','Indexed AVI');
movieObj.FrameRate = 25;
movieObj.Colormap = map;

open(movieObj);


 for i=1:numel(centerXtrajectory)
       writeVideo(movieObj, imageCircle{1,i});
 end

   close(movieObj);
   implay('video.avi');