 by
by
In this lecture, we explain Poisson’s ratio.
Consider the situation shown in Fig. 1 below.
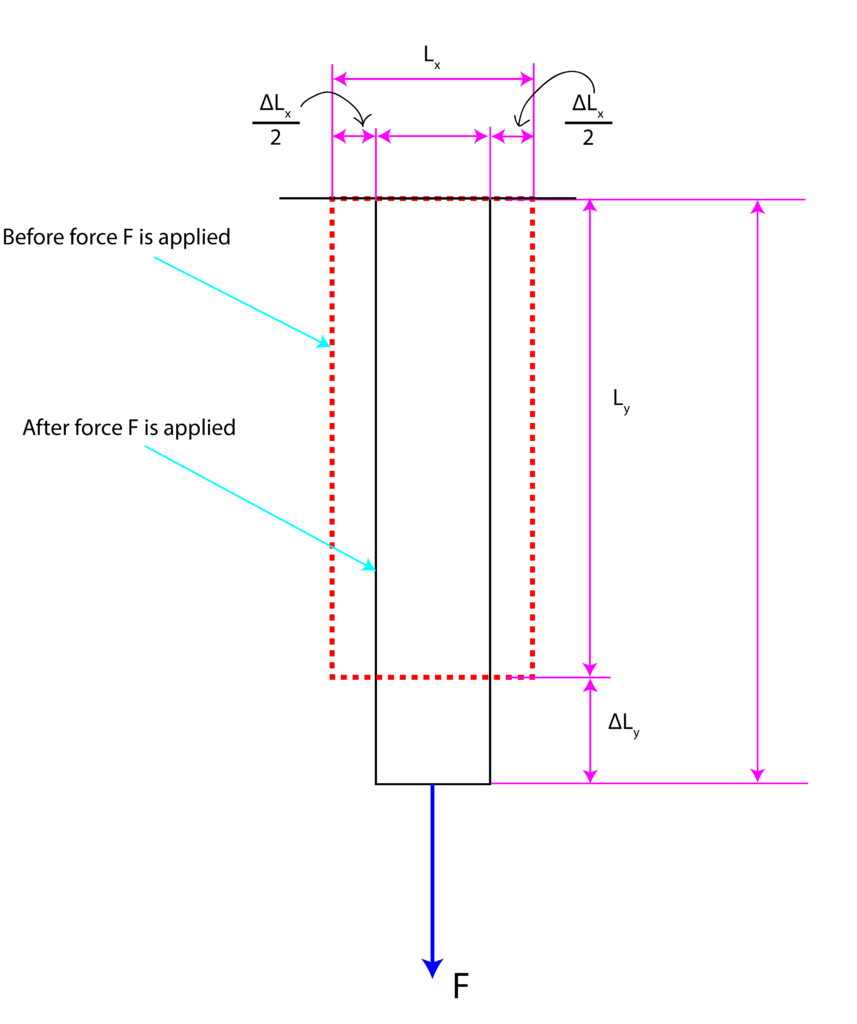
Force  is applied in the
  direction. We assume that the produces stress is in the elastic range. That is, the stress is smaller than the elastic limit. Naturally, the element will expand in the direction. For most of the materials used in engineering practice, this elongation in the direction will produce deformation in the
  direction. Also, in the majority of deformation cases, expansion in one direction will produce contraction in the -direction (direction perpendicular to the action of the force). The initial shape of the element is denoted by the red dashed line. The final deformation after the action of force is denoted by the black solid line. The strain in the direction is defined by
(1) 
where  is the deformation in the direction, defined by
(2) 
where  and
and  are the final and initial deformations in the direction. On the other hand, the strain in the direction is defined by
(3) 
where  is the deformation in the direction, defined by
(4) 
where  and
and  are the final and initial deformations in the direction. Here it should be emphasized that has a negative sign since it is assumed that
  .
.
Poisson’s ratio is defined by
(5) 
The minus sign comes from the fact that  is negative and we have to add a minus sign in order to make Poisson’s ratio
  positive.
For most of the materials used in the practice Poisson’s ratio is in the range of 0 to 0.5. For most of the solids, Poisson’s ratio is in the range of 0.2 to 0.3. For example, Aluminum alloys have Poisson’s ratio in the range of 0.32 to 0.35. Steel alloys have Poisson’s ratio in the range of 0.28 to 0.31.
A nice summary of Poisson’s ratio with values for typical materials used in practice is given here.