 by
by In this post and in the accompanying video, we explain how to use the MATLAB function fsurf() to create 3D surface plots. Besides the function fsurf(), we can also use the function surf() to create 3D plots. However, this post is only dedicated to the function fsurf(). The YouTube video accompanying this post is given below.
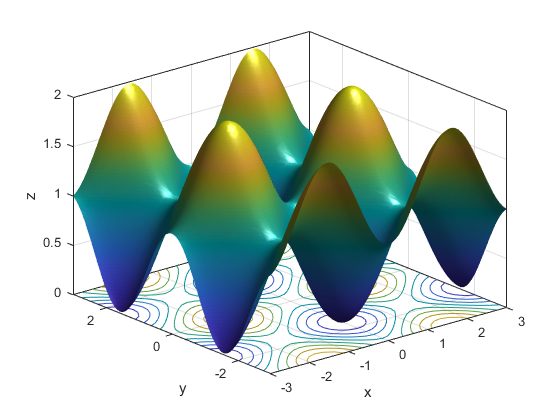
First, we explain how to plot this function
(1) 
The function 3D plot is shown below.
The MATLAB code for defining and plotting this function is given below.
clear,pack,clc

z=@(x,y) (sin(x))^2+(cos(y))^2
x_l=-3
x_u=3
y_l=-3
y_u=3
bounds=[x_l x_u y_l y_u]
z_output=fsurf(z,bounds)
xlabel('x');
ylabel('y');
zlabel('z');
Code line 3 is used to define the function. The notation @(x,y) means that the function is evaluated at  and
and  . That is, and are the arguments. The code lines 4-8 are used to define the bounds of the and variables. The function fsurf() on code line 9 is used to plot the function. The code lines 10-12 are used to define the axis variables.
The function fsurf() returns the output structure “z_output” that can be used to modify the plotting parameters. The edge color can be controlled using the following code lines.
% No edge color: z.EdgeColor='none',  EdgeColor -
% Edge colors: 'g'- green ,'m'- magenta, 'b' -black
z_output.EdgeColor='none'
Transparency can be controlled by adjusting the transparency parameter FaceAlpha. The zero value corresponds to a completely transparent plot, and the value of one corresponds to a completely nontransparent plot. Any value between zero and one can be used to control transparency.
%Transparency
% z.FaceAlpha=0 - completely transparent,
% z.FaceAlpha=1 not transparent
% z.FaceAlpha=0-1, control transparency
z_output.FaceAlpha=1
Contours can be controlled by the following code lines.
% Contours
% z.ShowContours='on'
% z.ShowContours='off'
z_output.ShowContours='on'
Mesh density, camera light, and box lines can be controlled by using the following code lines
% Control the mesh density
% Default mesh density is 35
z_output.MeshDensity= 40;
% camera light
camlight
box on
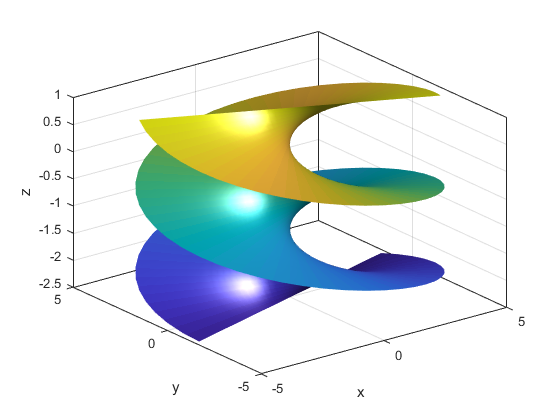
Next, we explain how to plot a parametric 3D function. We plot a helicoid surface defined by the following equations
(2) 
where  and
and  are the independent variables. This surface is shown in figure below.
The MATLAB code for plotting this surface is given below.
% parametric surface
% Helicoid
clear,pack,clc

x_equation=@(u,v) u*sin(v)
y_equation=@(u,v) u*cos(v)
z_equation=@(u,v) 0.5*v

u_l=-5
u_u=5
v_l=-5
v_u=2

bounds=[u_l u_u v_l v_u]

z_parametric=fsurf(x_equation,y_equation,z_equation,bounds)
xlabel('x');
ylabel('y');
zlabel('z');
z_parametric.MeshDensity= 50;
z_parametric.EdgeColor='none'
z_parametric.FaceAlpha=1
box on
camlight
x,y,z coordinates are defined as functions of and in code lines 5-7. The bounds of the variables and are defined in code lines 9-14. The surf function with its parameters are given in code line 16.