In this tutorial, we explain how to import signals and arrays from MATLAB to Simulink. The main motivation for learning how to import signals from MATLAB workspace to Simulink comes from the fact that you often need to perform complex calculations on arrays in MATLAB and later on you need to import them to Simulink for further processing. For example, if you are simulating a control system, you would need to define random or colored process disturbances in MATLAB and later on, you need to include these signals in a closed-loop control system in Simulink. The YouTube tutorial is given below.
First, we will define two signals (arrays) and MATLAB. Then, we will embed these two signals into a special data structure that will be imported inside of a Simulink simulation. Finally, we will create a Simulink block diagram. For test purposes, we will define squared sine and cosine signals, and then we will add them inside of a Simulink simulation. The result should be equal to 1. In this way, we can test the complete import process.
The first step is to create a MATLAB script that defines the two signals:
inputStructure.time=[0:0.01:10]'

inputSignal1=(sin(4*inputStructure.time)).^2
inputSignal2=(cos(4*inputStructure.time)).^2

inputStructure.signals(1).values=inputSignal1
inputStructure.signals(1).dimensions=1

inputStructure.signals(2).values=inputSignal2
inputStructure.signals(2).dimensions=1
This MATLAB script creates a data structure called inputStructure. First, we define the time array. Then, we define two signals and embed them inside of the data structure.
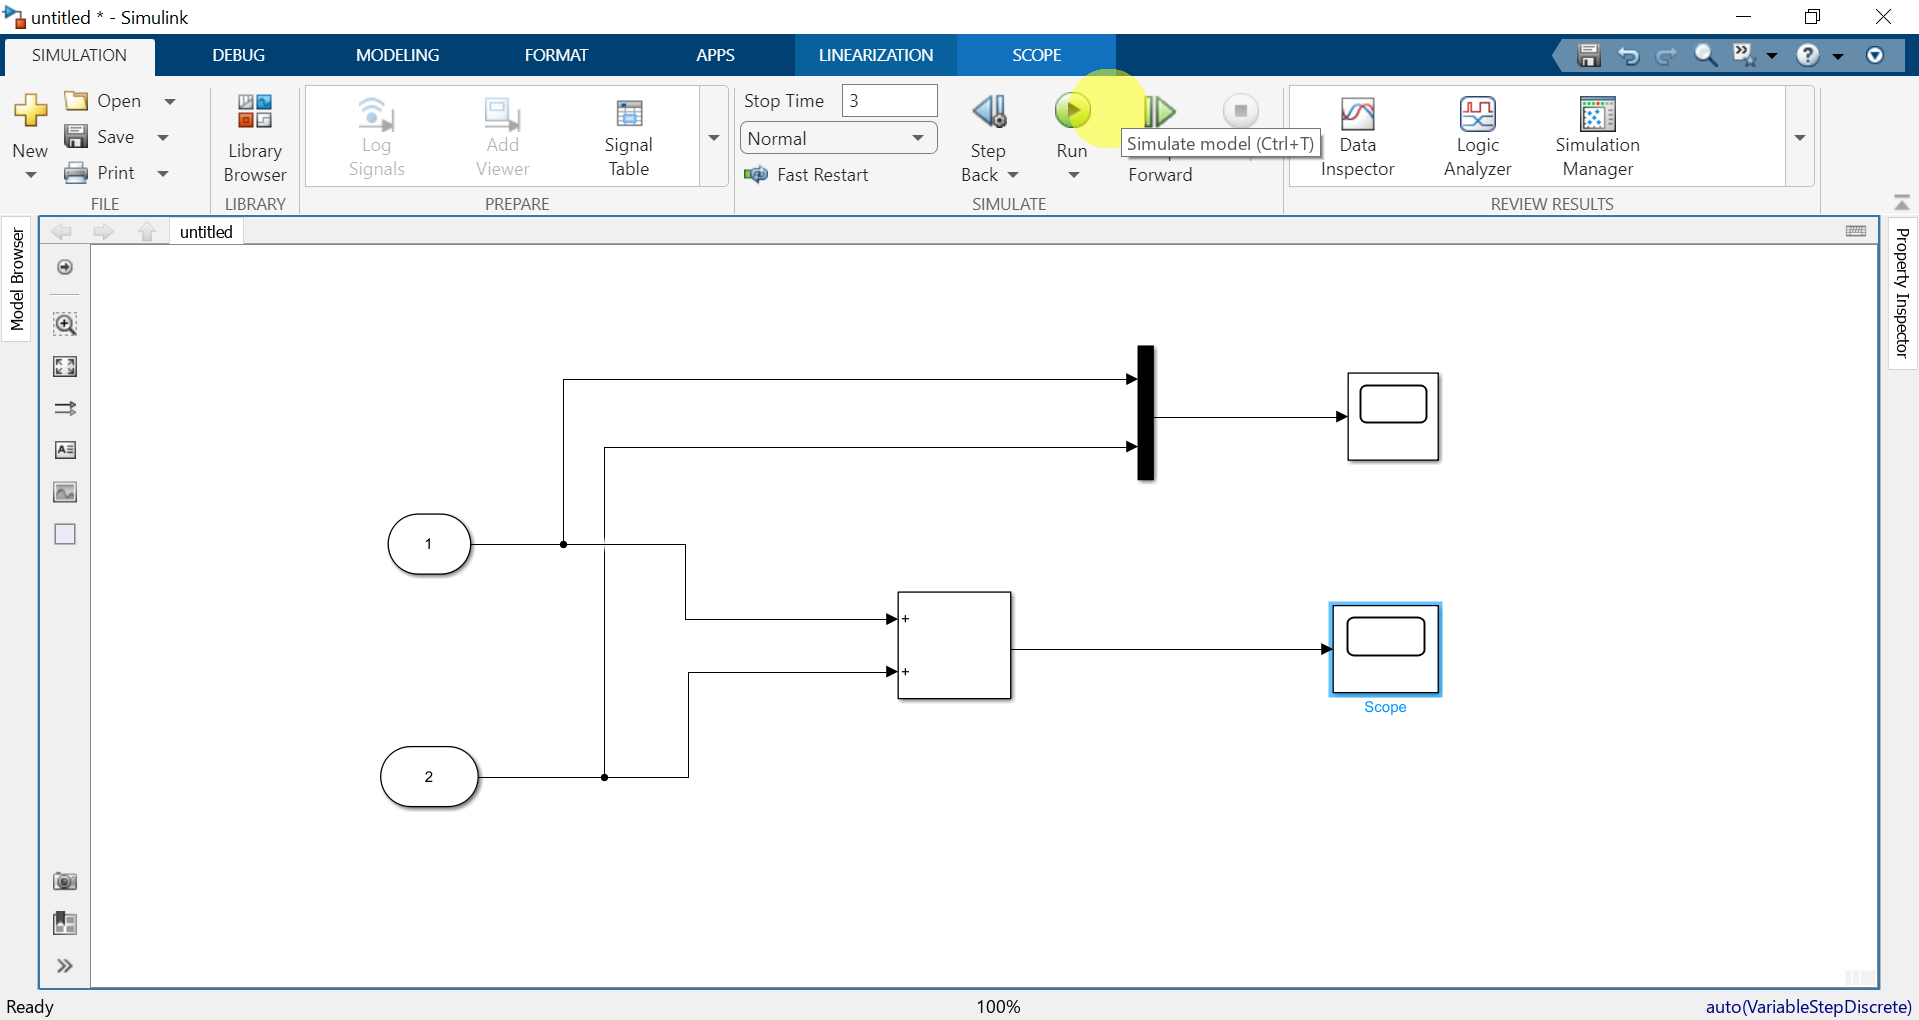
The next step is to create the Simulink block diagram shown in the figure below.
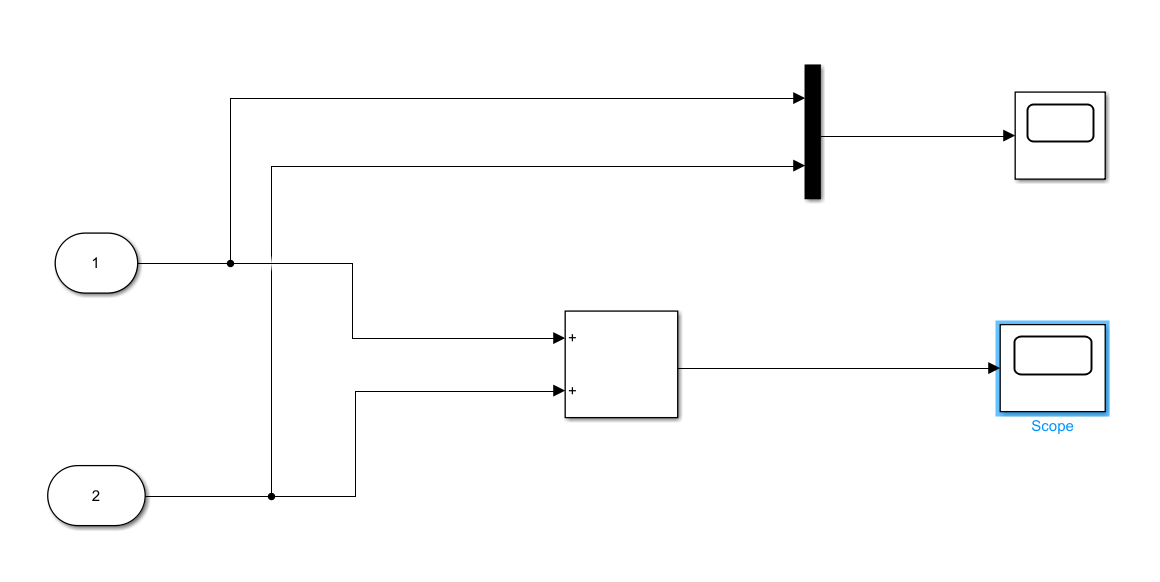
This Simulink block diagram consists of two Inport blocks denoted by 1 and 2, add block, mux block, and two scopes. The first scope will be used to plot the two signals on the same graph and the second scope will be used to plot the result of adding two signals by the add block.
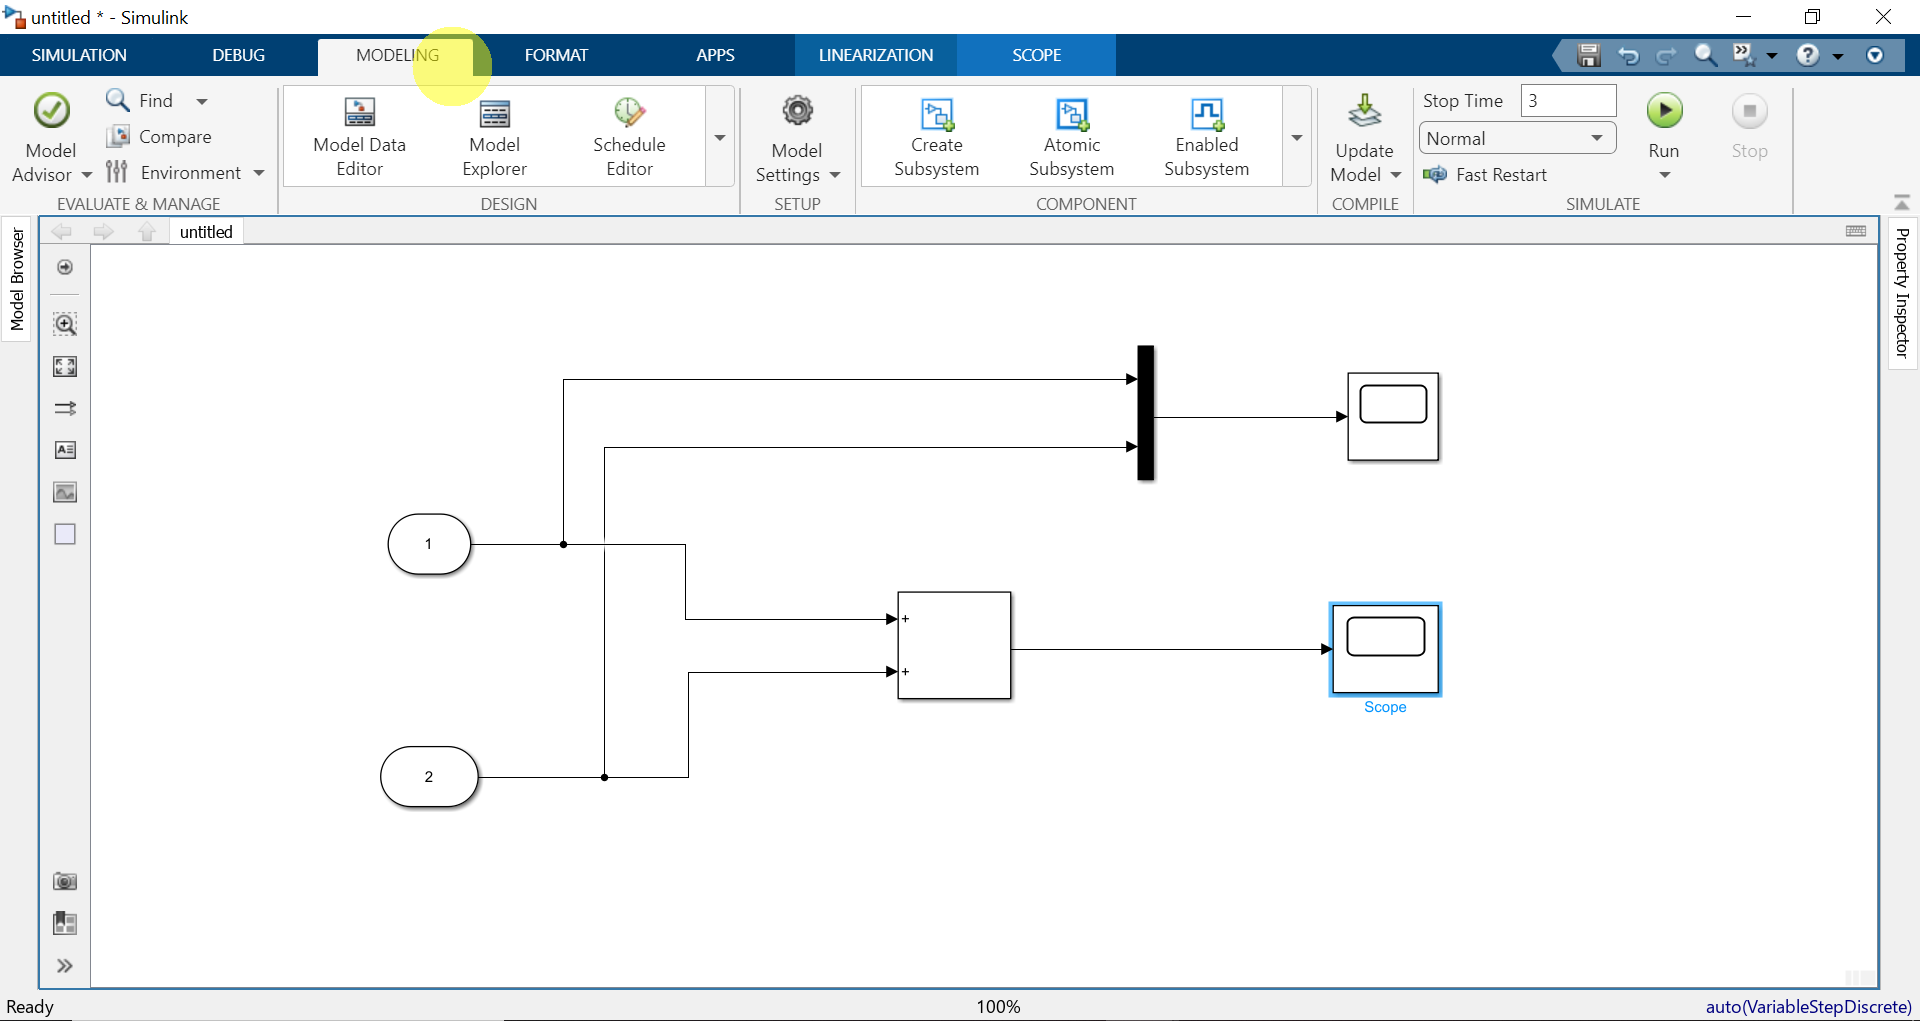
The next step is to import the signals and the data structure defined in the MATLAB script into the Simulink simulation. To do that, click on MODELING as shown in the figure below
then, click on Model Settings as shown in the figure below
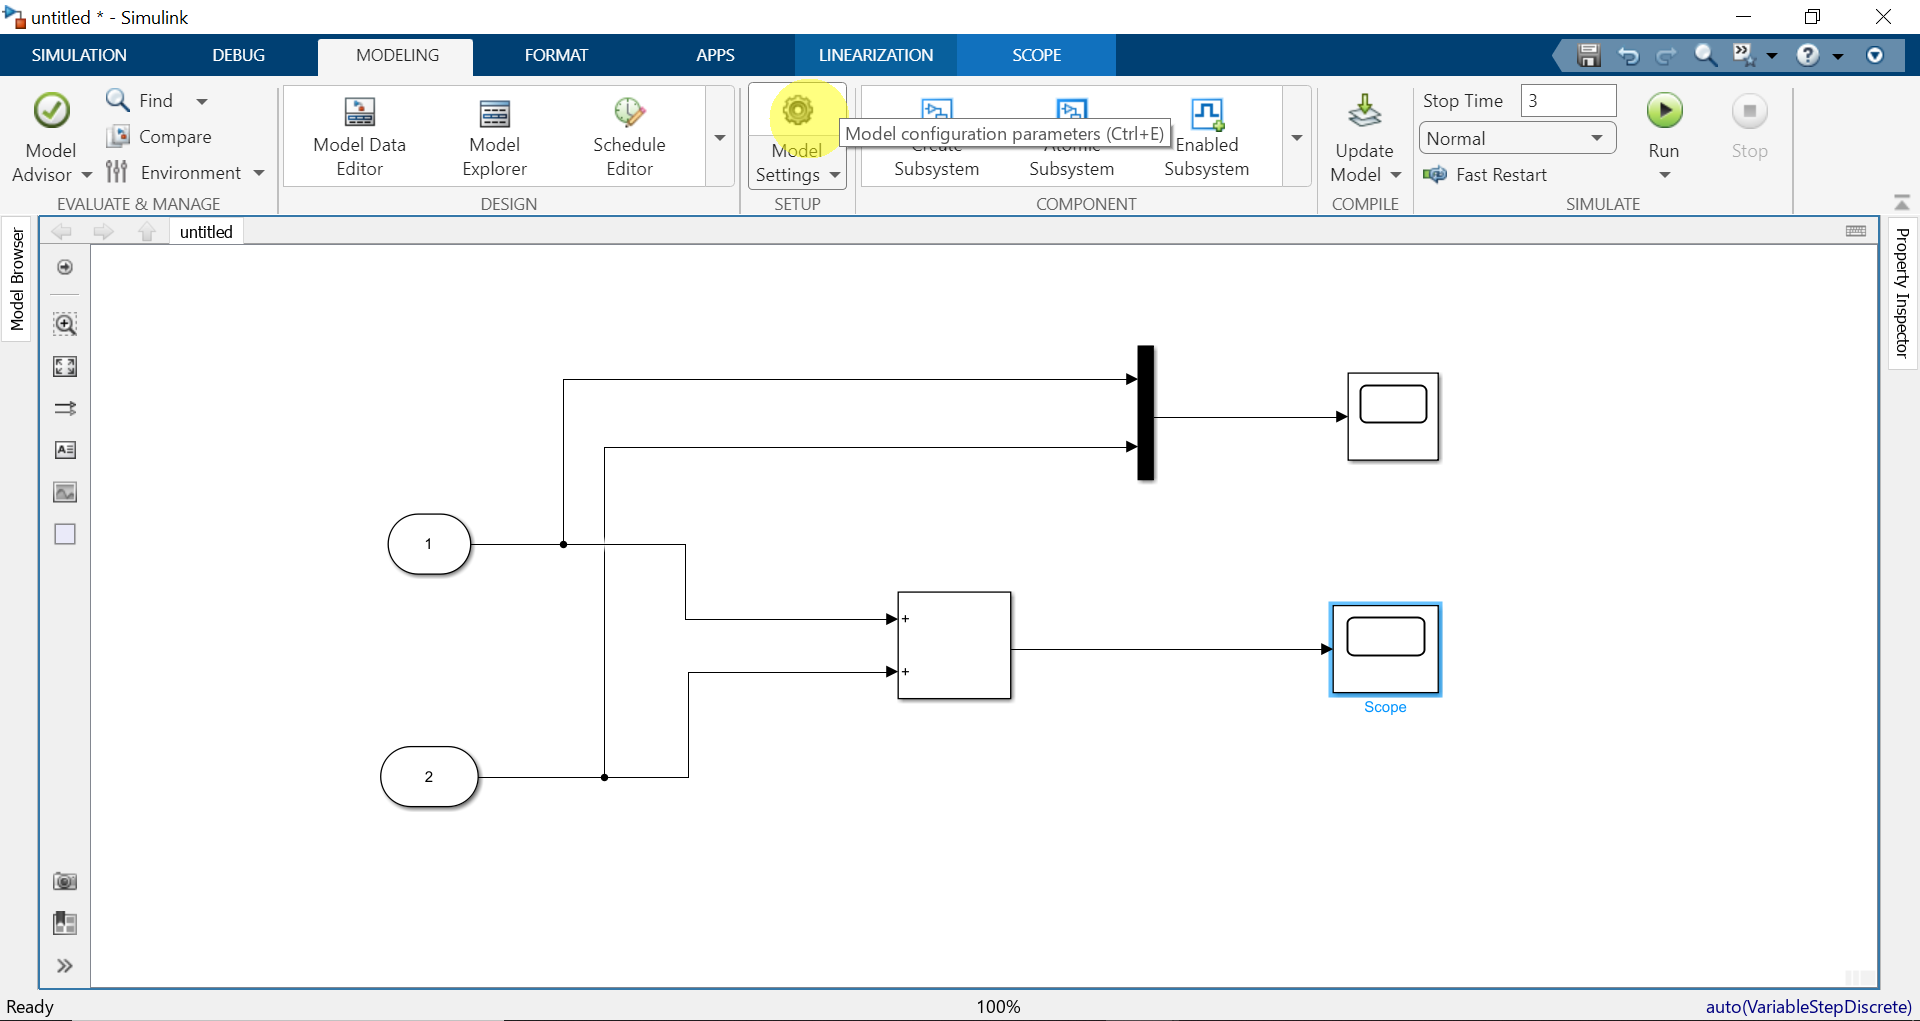
Then, click on Input, and in the Input field enter the name of the input structure define in the MATLAB script. The name of the input structure is “inputStructure”.
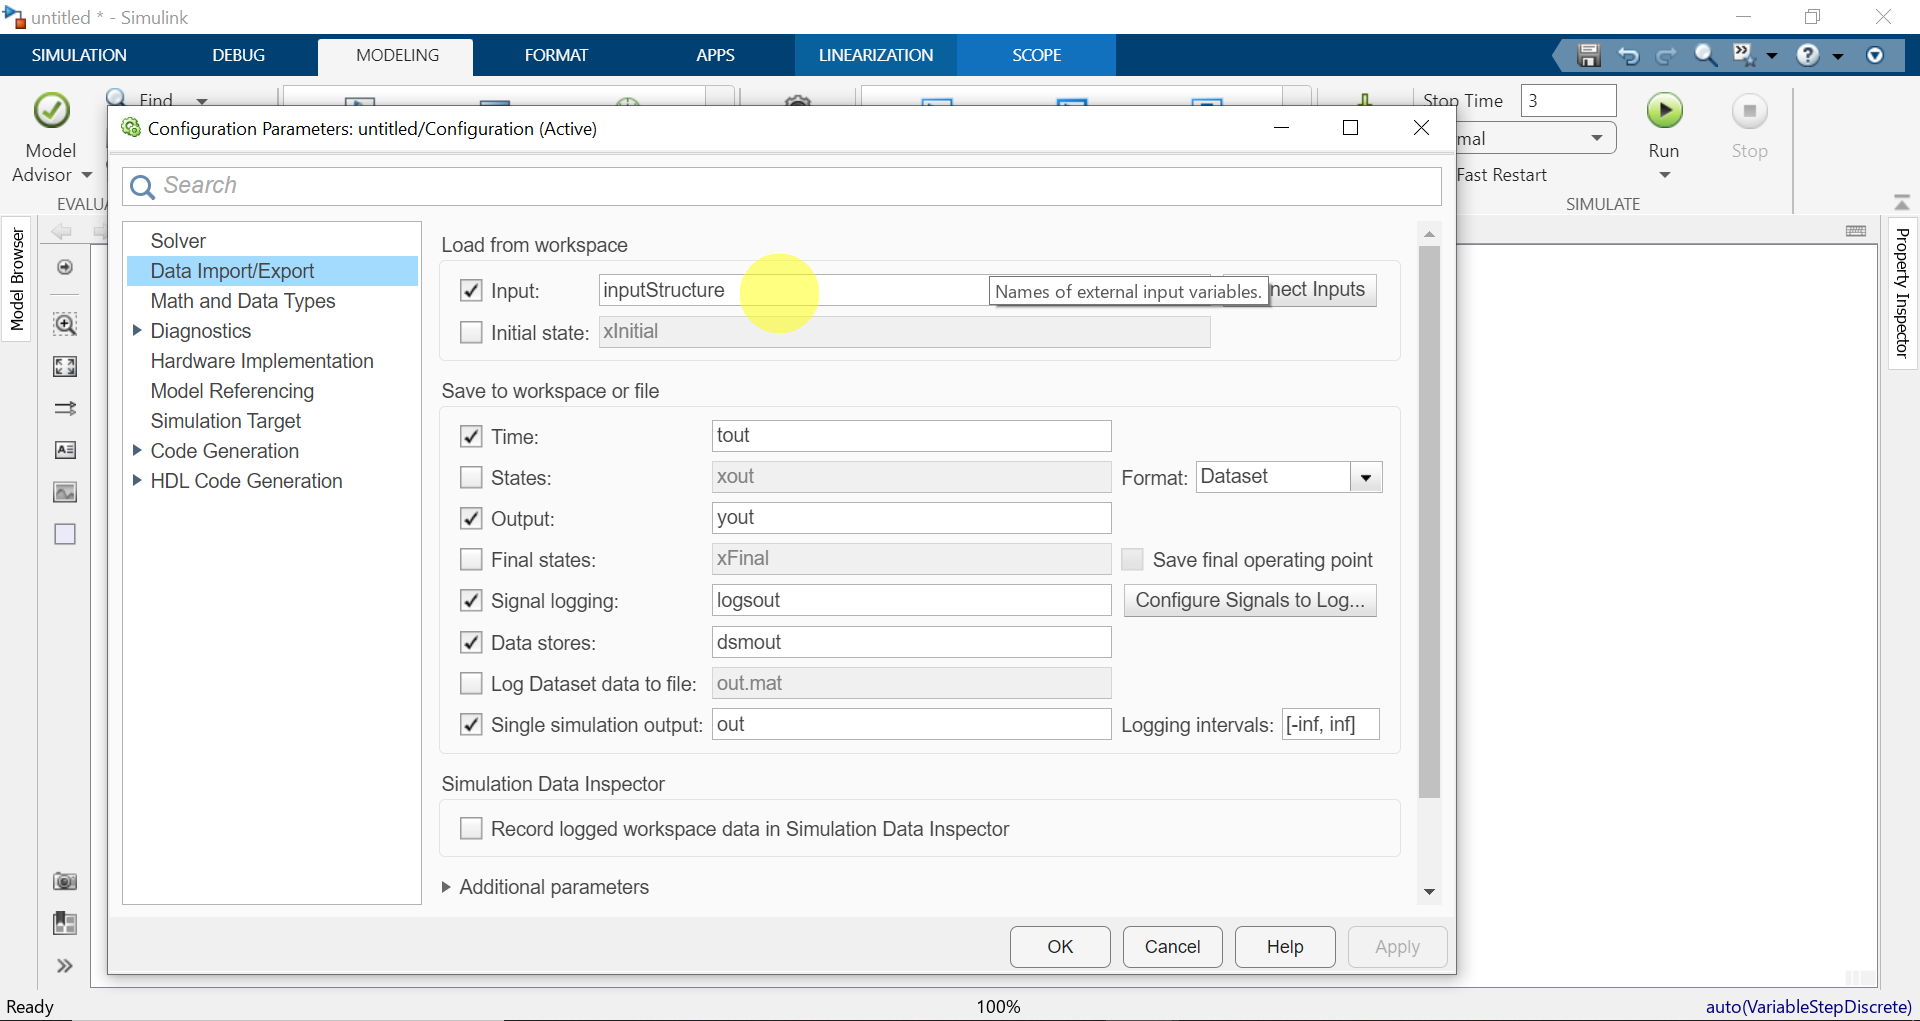
After that, click on Apply and OK.
Then, click on SIMULATION and click on Run to run the simulation as shown in the figure below.
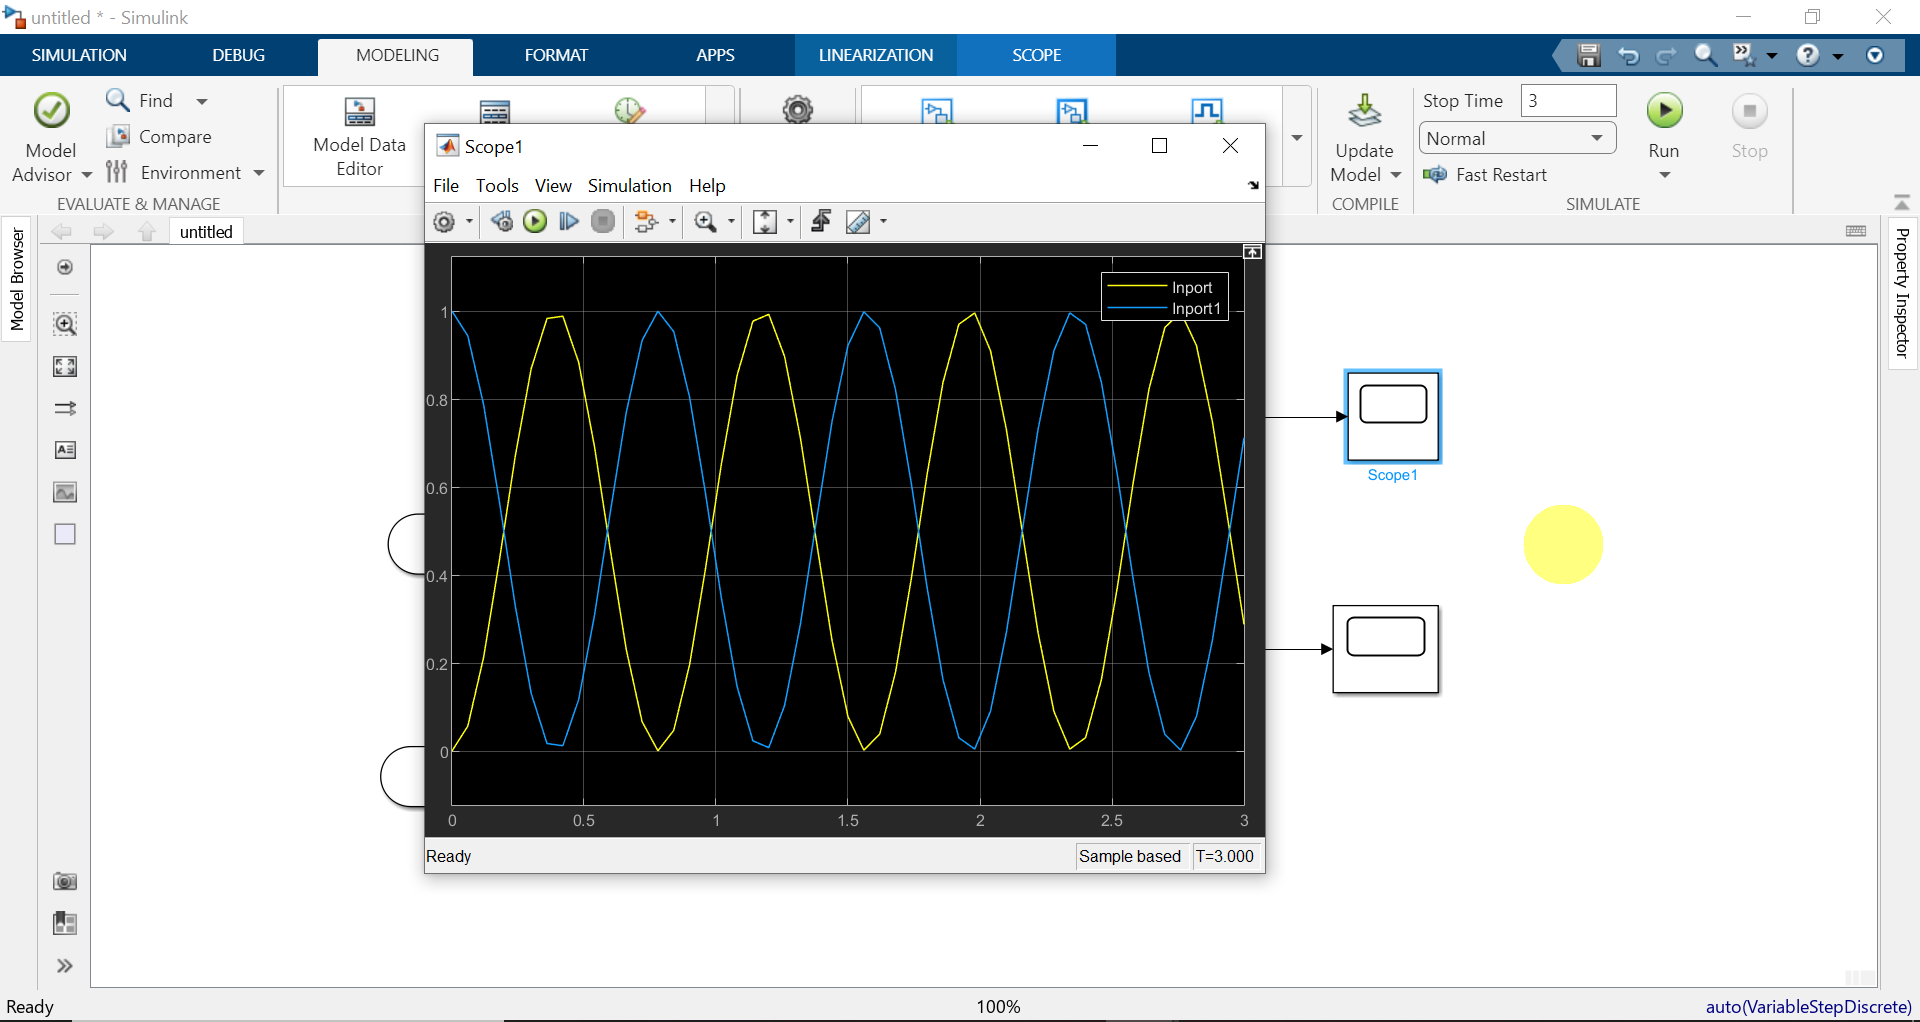
To see both signals click on the first scope. The graph is shown below.
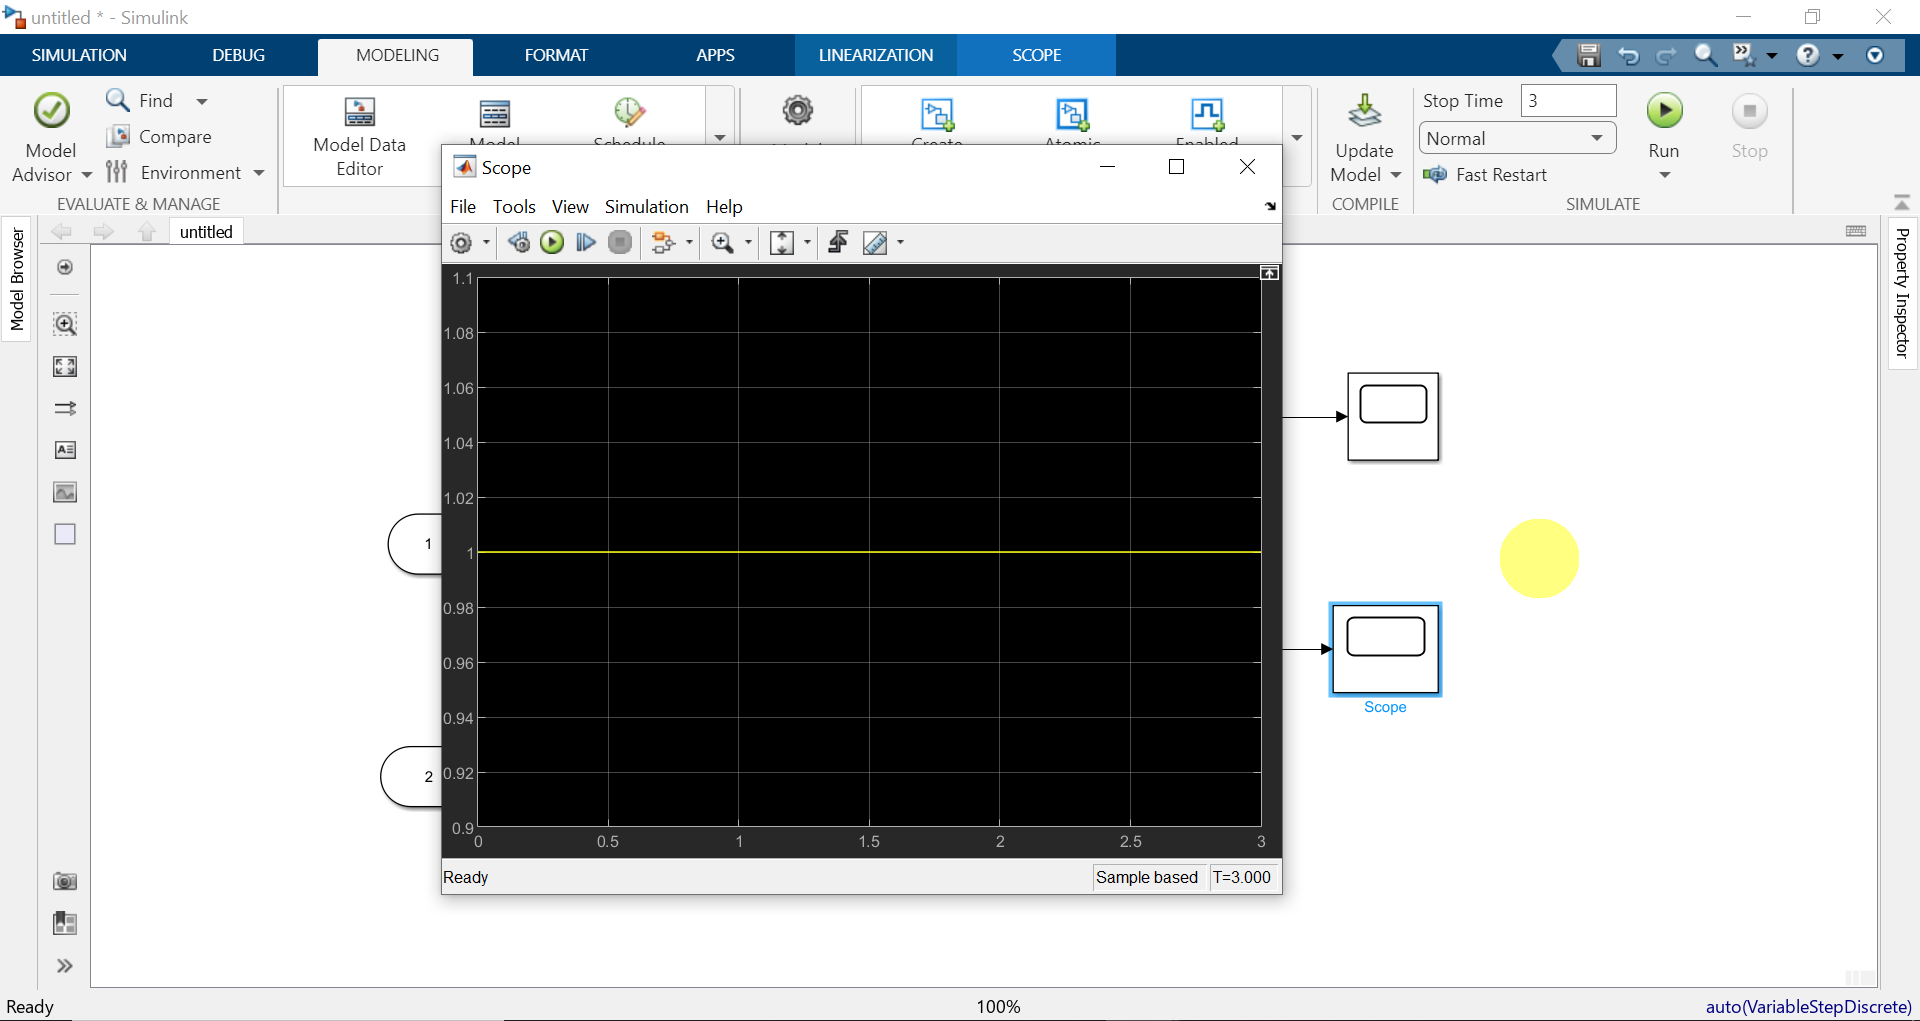
To see the result of adding the two signals, click on the second scope. The graph is shown below.
