by
by In this tutorial, we explain how to generate a Bode plot in LTspice. The tutorial is given below.
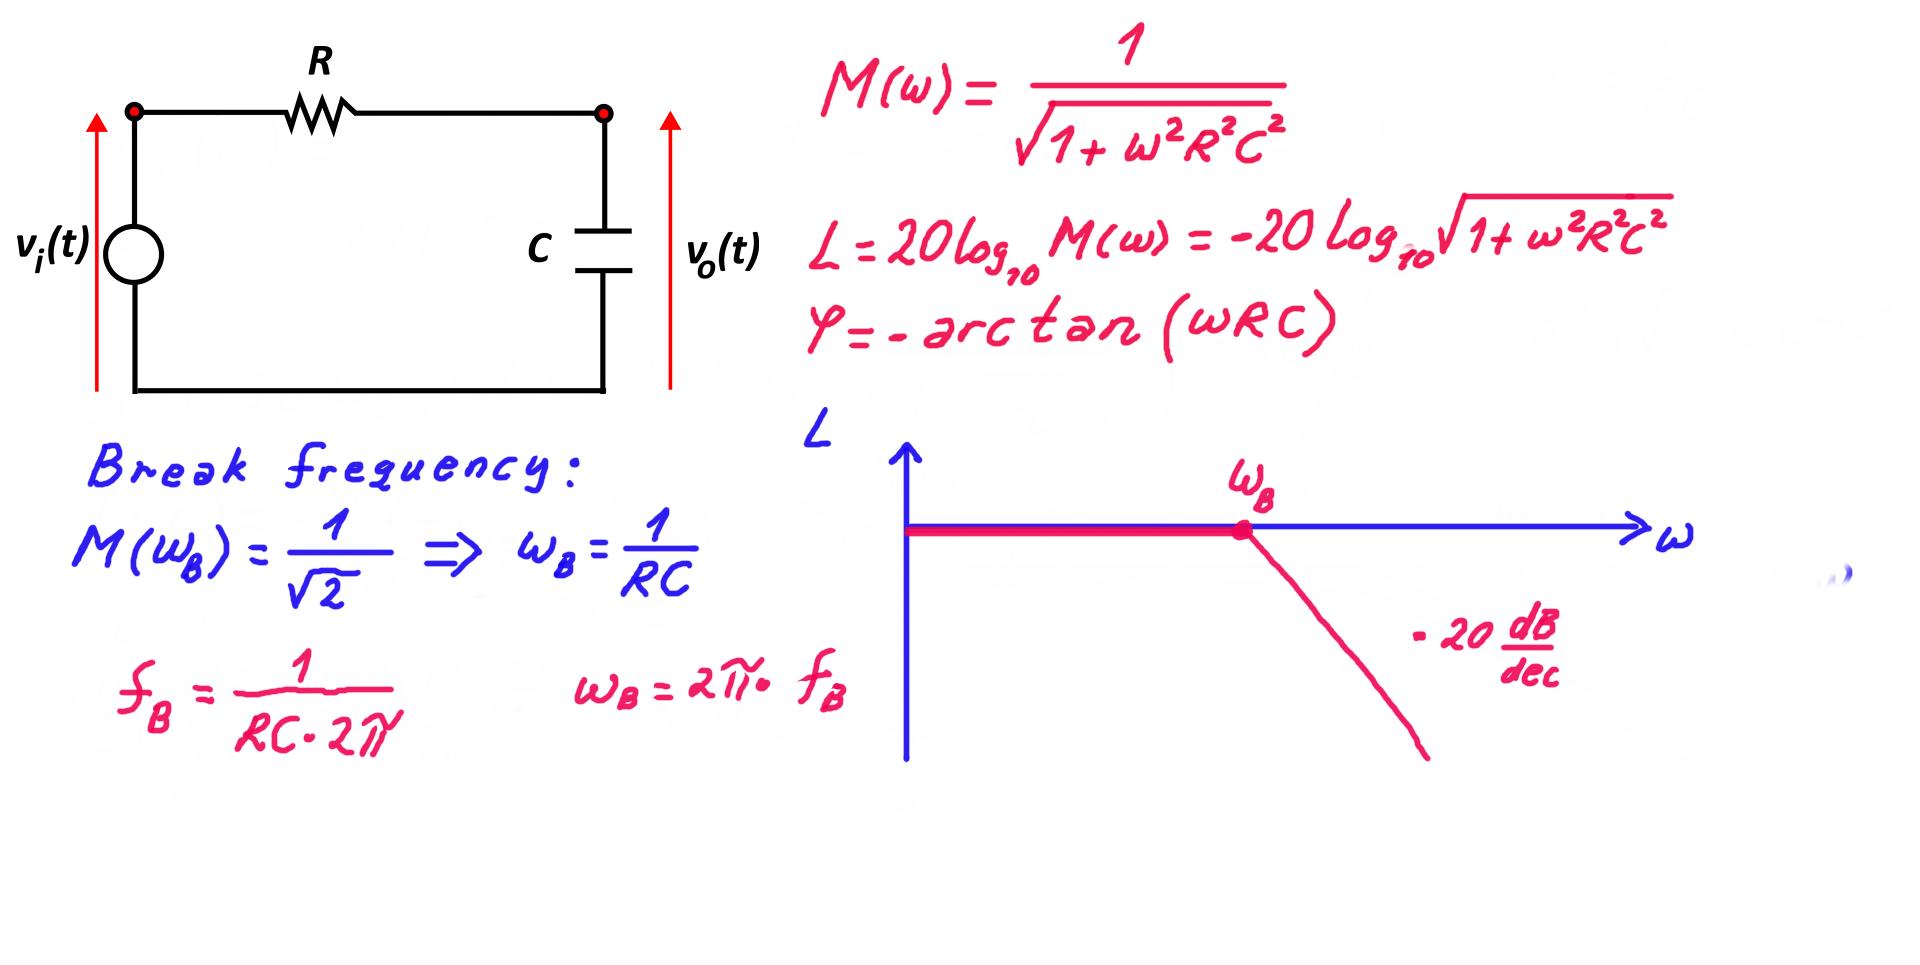
To generate the Bode plot, we are using the RC circuit shown below.

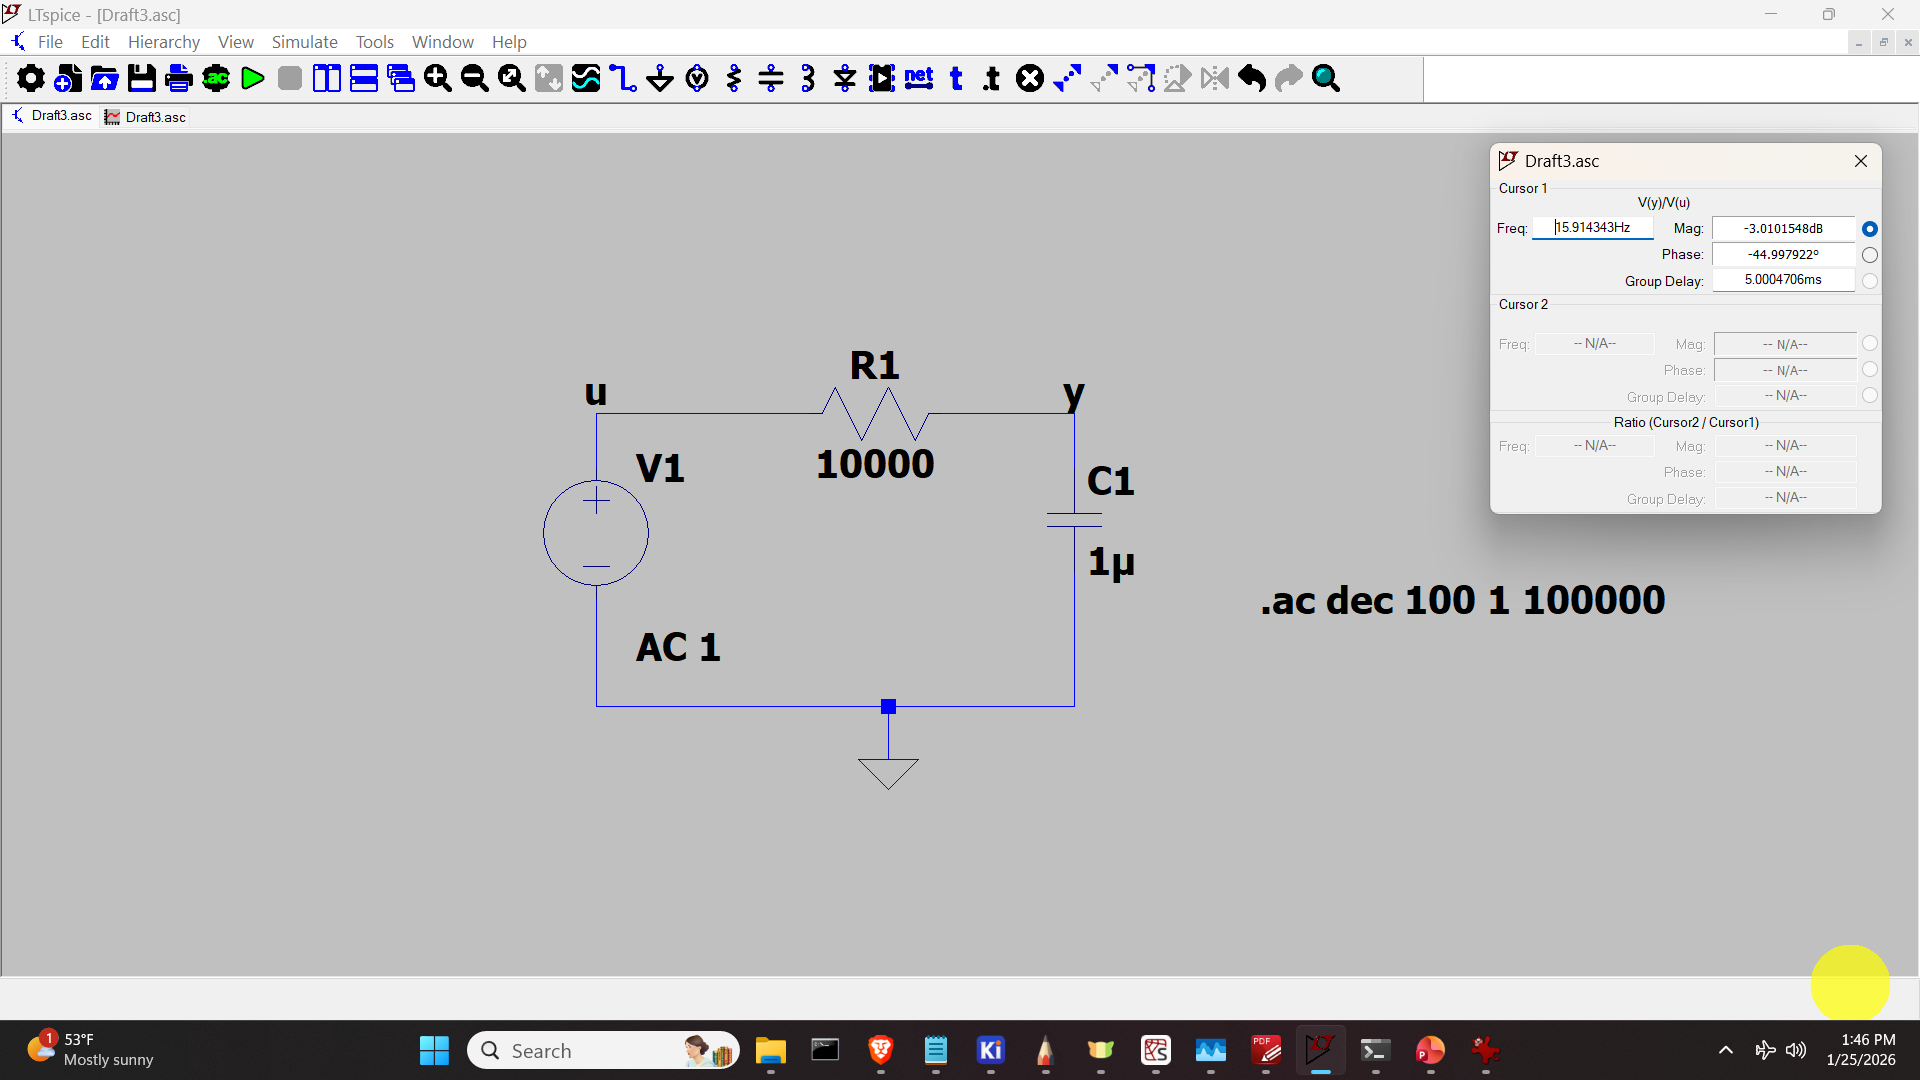
The LTspice model of this circuit is shown below. Enter the resistance value of 10000 and capacitance of 0.0000001.
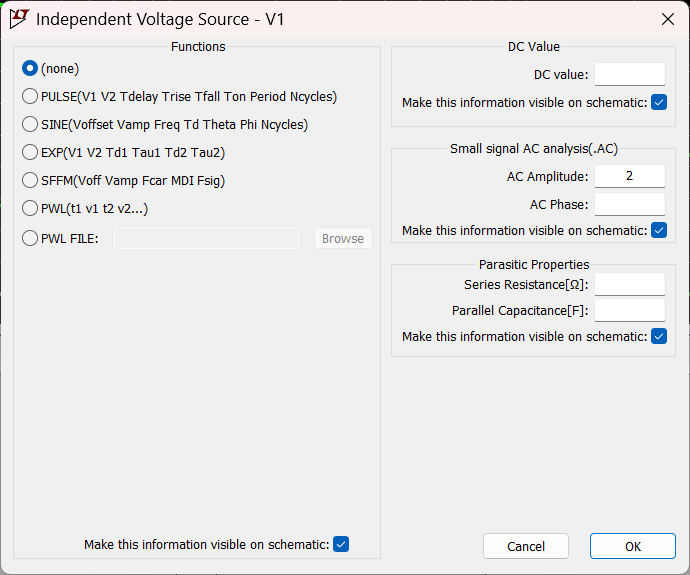
To generate the Bode plot, do the right click on the voltage source, and enter in the Small signal AC analysis the amplitude of the input signal as shown in the figure below.
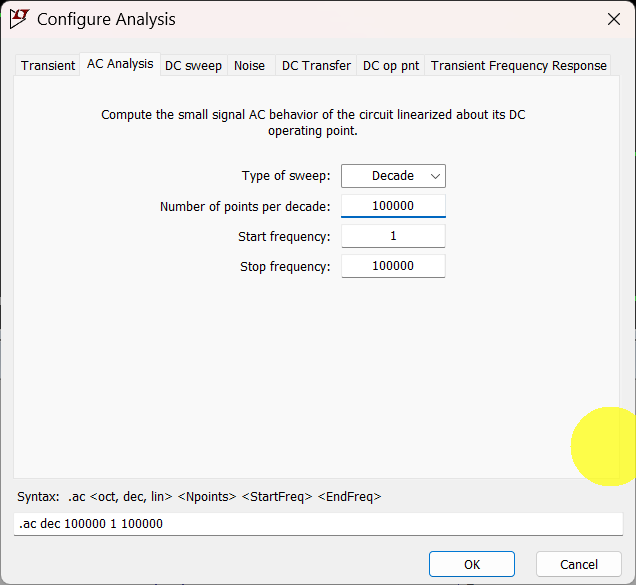
Then, we need to adjust the simulation configuration. To do that, do the right click and click on Configure Analysis.
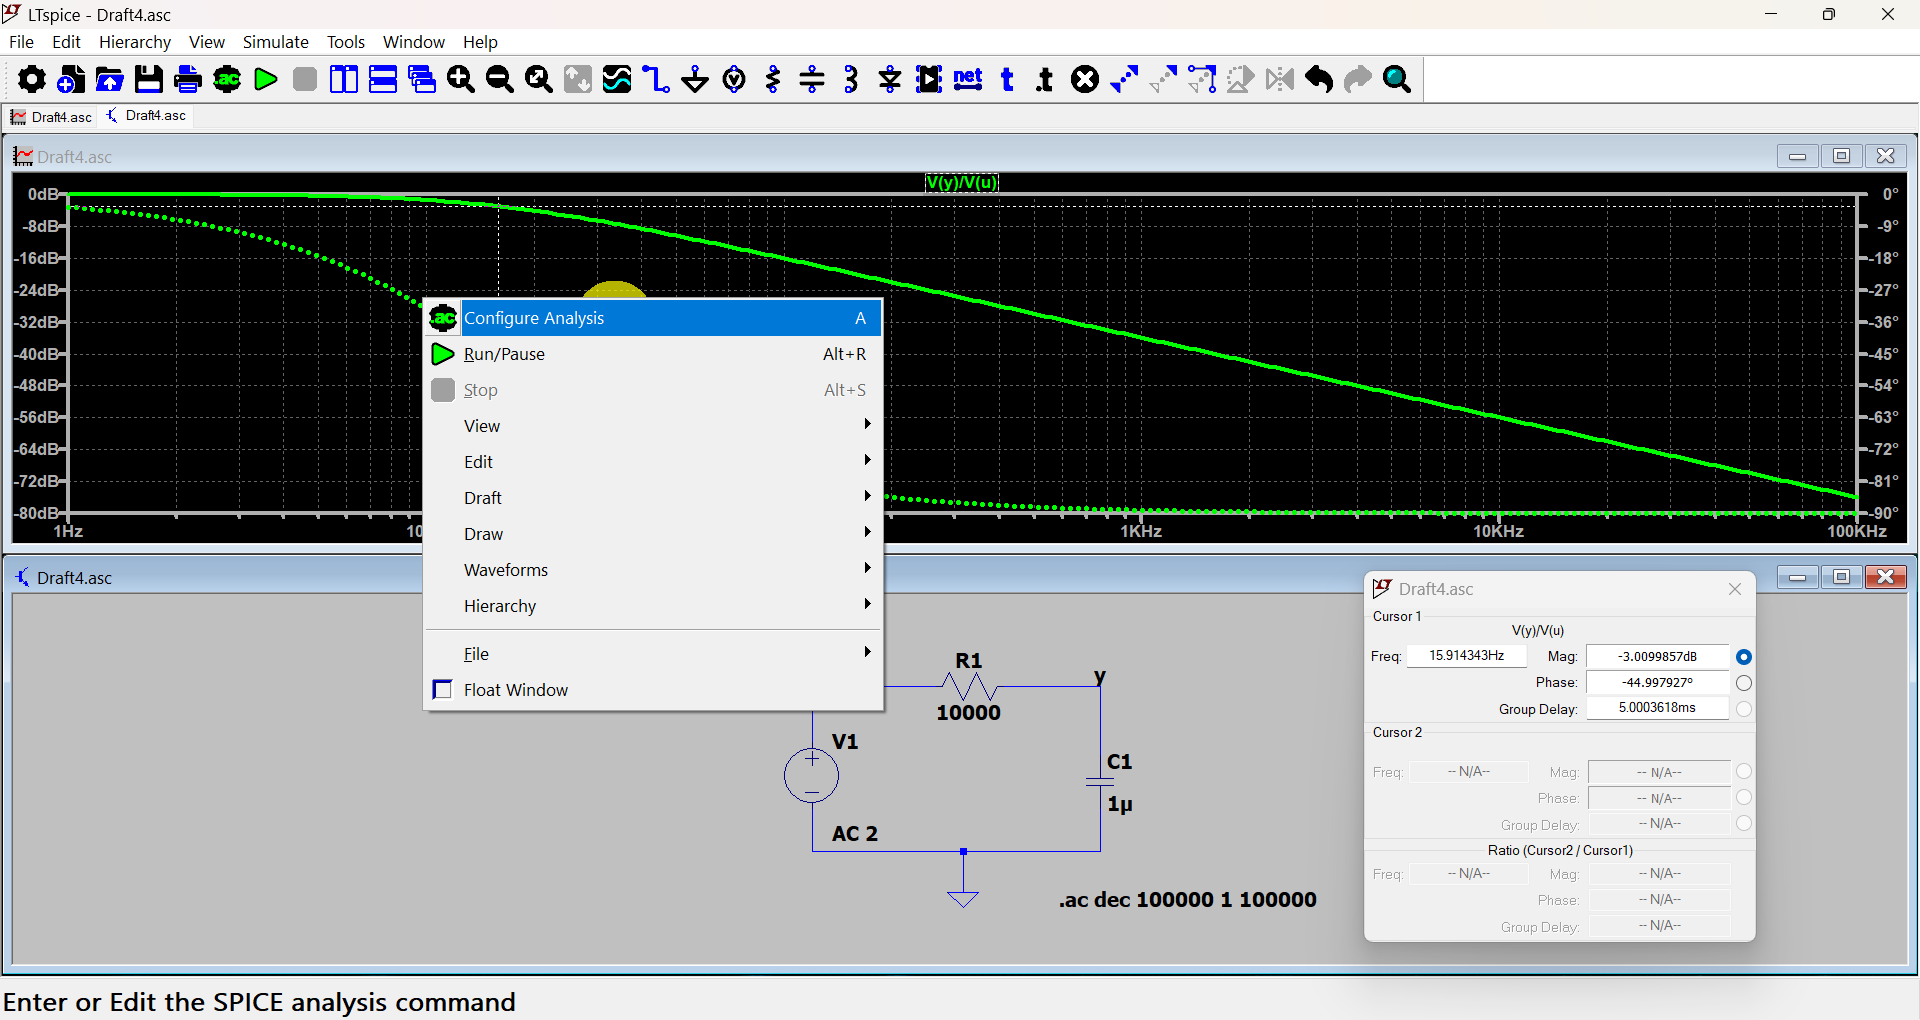
Then, click on AC Analysis and enter the sweep, and enter the other fields as shown in the figure below.
Finally, run the simulation. The results are shown in the figure below.
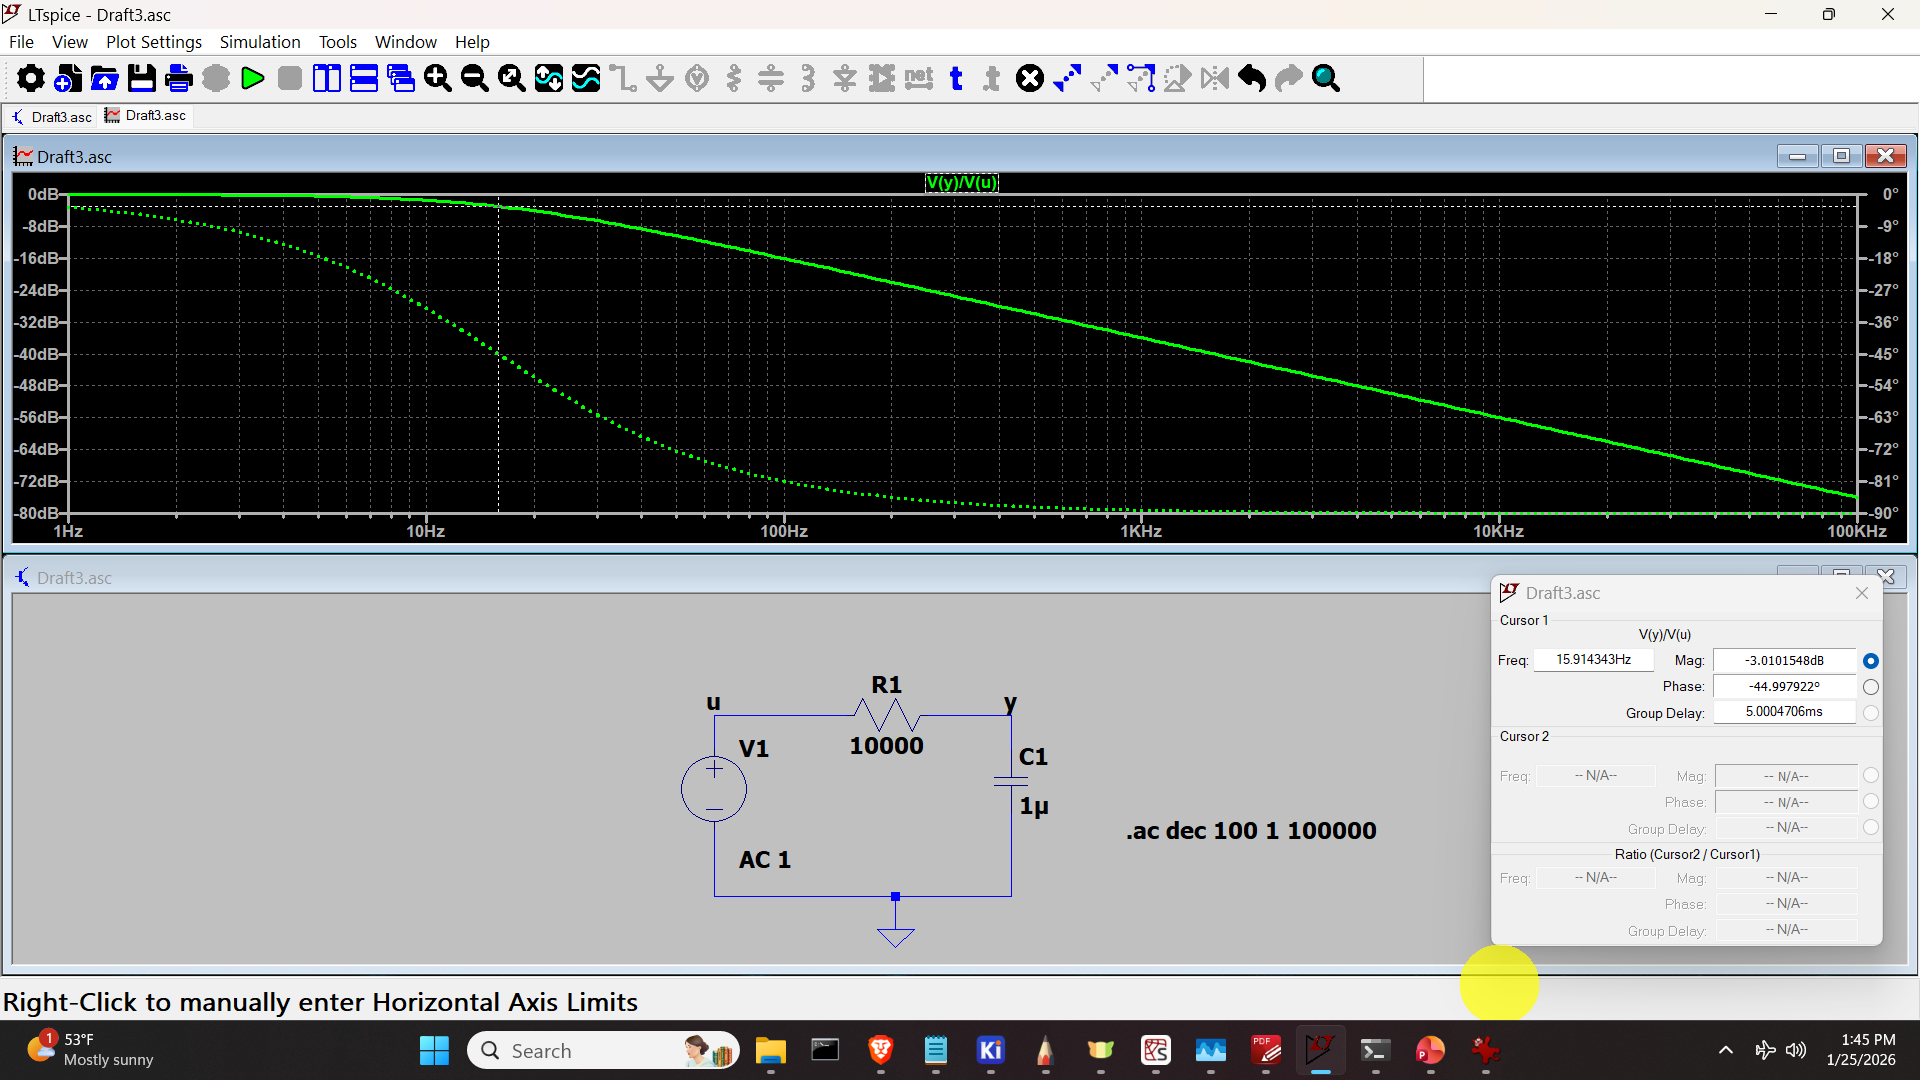
Below, we show the analytical formulas for the frequency response. These formulas can be used to validate the simulation results.