 by
by In this Python, Plotly, and Dash tutorial, we explain how to quickly create interactive plots, dashboards, and web apps using Dash. Dash is a very powerful and simple-to-use program for creating Python interactive dashboards, apps, and Web programs by using only a few lines of code. In the tutorial, we explain how to use Dash to create Python interactive apps that read data from Pandas databases and display data in a web application. The technique explained in this tutorial can be used to display the content of Pandas data frames in an interactive web application where a user can select and filter the data. The YouTube video accompanying this tutorial is given below.
The resulting web application looks like this:
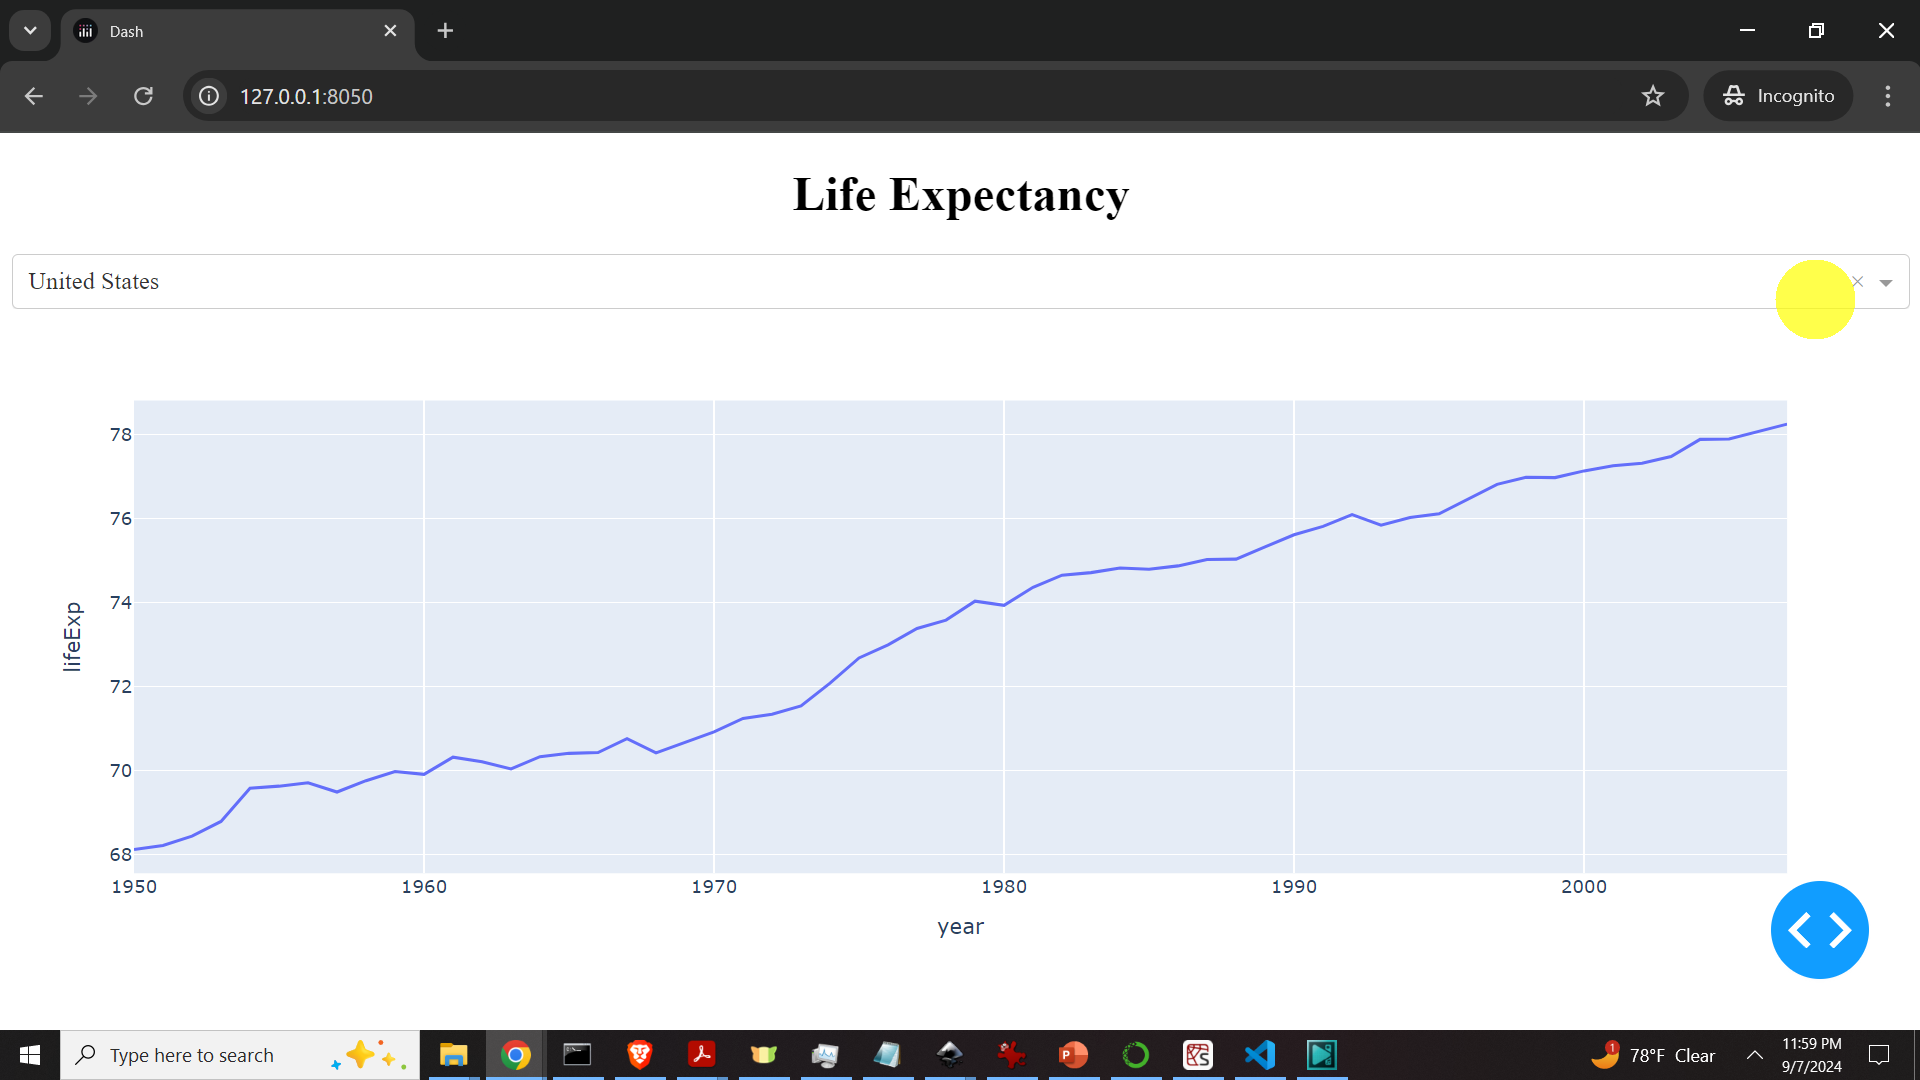
This application reads a pandas data frame and displays the data. The data is the life expectancy of the function of time. The country can be selected by the user by using the menu at the top left corner. The application is run in a web browser locally on the address: 127.0.0.1:8050
This application reads the pandas data frame that is loaded from the csv file provided at this link
https://raw.githubusercontent.com/plotly/datasets/master/gapminder_unfiltered.csv
Developing the Web Application
Open a terminal and install Dash, Numpy, and Pandas:
pip install dash
pip install numpy
pip install pandas
First of all, let us open a temporary Python script and let us download the data set in order to better understand it:
import pandas as pd

# create pandas series

df = pd.read_csv('https://raw.githubusercontent.com/plotly/datasets/master/gapminder_unfiltered.csv')
Let us inspect the columns and rows of this Pandas DataFrame:
df.columnsIndex(['country', 'continent', 'year', 'lifeExp', 'pop', 'gdpPercap'], dtype='object')To see the list of countries, we need to type
df.country.unique()The output is
array(['Afghanistan', 'Albania', 'Algeria', 'Angola', 'Argentina',
       'Armenia', 'Aruba', 'Australia', 'Austria', 'Azerbaijan',
       'Bahamas', 'Bahrain', 'Bangladesh', 'Barbados', 'Belarus',
       'Belgium', 'Belize', 'Benin', 'Bhutan', 'Bolivia',
       'Bosnia and Herzegovina', 'Botswana', 'Brazil', 'Brunei',
       'Bulgaria', 'Burkina Faso', 'Burundi', 'Cambodia', 'Cameroon',
       'Canada', 'Cape Verde', 'Central African Republic', 'Chad',
       'Chile', 'China', 'Colombia', 'Comoros', 'Congo, Dem. Rep.',
       'Congo, Rep.', 'Costa Rica', "Cote d'Ivoire", 'Croatia', 'Cuba',
       'Cyprus', 'Czech Republic', 'Denmark', 'Djibouti',
       'Dominican Republic', 'Ecuador', 'Egypt', 'El Salvador',
       'Equatorial Guinea', 'Eritrea', 'Estonia', 'Ethiopia', 'Fiji',
       'Finland', 'France', 'French Guiana', 'French Polynesia', 'Gabon',
       'Gambia', 'Georgia', 'Germany', 'Ghana', 'Greece', 'Grenada',
       'Guadeloupe', 'Guatemala', 'Guinea', 'Guinea-Bissau', 'Guyana',
       'Haiti', 'Honduras', 'Hong Kong, China', 'Hungary', 'Iceland',
       'India', 'Indonesia', 'Iran', 'Iraq', 'Ireland', 'Israel', 'Italy',
       'Jamaica', 'Japan', 'Jordan', 'Kazakhstan', 'Kenya',
       'Korea, Dem. Rep.', 'Korea, Rep.', 'Kuwait', 'Latvia', 'Lebanon',
       'Lesotho', 'Liberia', 'Libya', 'Lithuania', 'Luxembourg',
       'Macao, China', 'Madagascar', 'Malawi', 'Malaysia', 'Maldives',
       'Mali', 'Malta', 'Martinique', 'Mauritania', 'Mauritius', 'Mexico',
       'Micronesia, Fed. Sts.', 'Moldova', 'Mongolia', 'Montenegro',
       'Morocco', 'Mozambique', 'Myanmar', 'Namibia', 'Nepal',
       'Netherlands', 'Netherlands Antilles', 'New Caledonia',
       'New Zealand', 'Nicaragua', 'Niger', 'Nigeria', 'Norway', 'Oman',
       'Pakistan', 'Panama', 'Papua New Guinea', 'Paraguay', 'Peru',
       'Philippines', 'Poland', 'Portugal', 'Puerto Rico', 'Qatar',
       'Reunion', 'Romania', 'Russia', 'Rwanda', 'Samoa',
       'Sao Tome and Principe', 'Saudi Arabia', 'Senegal', 'Serbia',
       'Sierra Leone', 'Singapore', 'Slovak Republic', 'Slovenia',
       'Solomon Islands', 'Somalia', 'South Africa', 'Spain', 'Sri Lanka',
       'Sudan', 'Suriname', 'Swaziland', 'Sweden', 'Switzerland', 'Syria',
       'Taiwan', 'Tajikistan', 'Tanzania', 'Thailand', 'Timor-Leste',
       'Togo', 'Tonga', 'Trinidad and Tobago', 'Tunisia', 'Turkey',
       'Turkmenistan', 'Uganda', 'Ukraine', 'United Arab Emirates',
       'United Kingdom', 'United States', 'Uruguay', 'Uzbekistan',
       'Vanuatu', 'Venezuela', 'Vietnam', 'West Bank and Gaza',
       'Yemen, Rep.', 'Zambia', 'Zimbabwe'], dtype=object)
The goal of the web application is to plot the country measure such as life expectation or population on the basis of the user selection of the country. Basically, for a selected country, the app should filter the Pandas DataFrame, for example, is “United States” is selected, the following operation should be performed
df2=df[df.country=='United States']
Then, we will select a column of the filtered DataFrame, and plot the graph. We will plot the life expectation as a function of year:
df2['lifeExp']Now, that we know what need to be done, we can write the application. Open a new script and type
from dash import Dash
from dash import html
from dash import dcc
from dash import callback
from dash import Output, Input
import plotly.express as px
import pandas as pd

# create pandas series

df = pd.read_csv('https://raw.githubusercontent.com/plotly/datasets/master/gapminder_unfiltered.csv')

app = Dash()

app.layout = [html.H1(children='Life Expectancy', style={'textAlign':'center'}),
    dcc.Dropdown(df.country.unique(), 'United States', id='dropdown-selection'), dcc.Graph(id='graph-content')
    ]

@callback(
    Output('graph-content', 'figure'),
    Input('dropdown-selection', 'value')
)

def update_graph(value):
    dff = df[df.country==value]
    return px.line(dff, x='year', y='lifeExp')


if __name__ == '__main__':
    app.run(debug=True)
Let us explain the script. After importing the necessary libraries and functions, and downloading the Pandas DataFrame, we call the Dash constructor to create an object called “app”. Then, we use app.layout() function to define what app should do. The following code
html.H1(children='Life Expectancy', style={'textAlign':'center'})Defines the heading of the application and the style of the text. Then,
dcc.Dropdown(df.country.unique(), 'United States', id='dropdown-selection')defines what will happen when a user presses a drop-down menu key. We will execute “df.country.unique()” and this will return the unique list of countries that will be displayed in the drop down menu. The default printed value is “United States”. The last command
dcc.Graph(id='graph-content')defines that a graph will be displayed. Next, we define a callback
@callback(
    Output('graph-content', 'figure'),
    Input('dropdown-selection', 'value')
)
This defines what happens once the user selects the country. The output is the figure, and the input is the value. This value is passed to this function
def update_graph(value):
    dff = df[df.country==value]
    return px.line(dff, x='year', y='lifeExp')
This function will filter the original Pandas DataFrame on the basis of the user-selected country (passes as “value”). The return value is the Plotly graph that will display ‘year’ column on the x axis and “lifeExp” (life expectancy) on the y axis.
Finally,
if __name__ == '__main__':
    app.run(debug=True)
is used to run the code. As the result, the following output will be written:
Dash is running on http://127.0.0.1:8050/
 * Serving Flask app 'testDash1'
 * Debug mode: on
By opening a web browser and by inserting the local address: http://127.0.0.1:8050/ the application will start.