In this Python, finance, and time series tutorial, we explain how to download the SPY stock time series and compute the Relative Strength Index (RSI) in Python. We also explain how to create a Python RSI stock screener. First, we briefly summarize the definition of the RSI value. The RSI value is used to identify oversold and overbought stocks and can be used to develop a simple trading algorithm.

Definition of RSI
Let the stock value at the discrete time instant 


(1) 

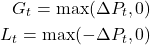
The next step is to separate the positive gains, denoted by 


(2) 

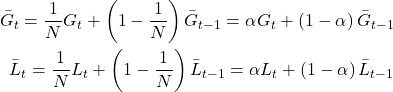
Next, we apply the Wilder’s exponential smoothing to gains and losses. First, we define the smoothing factor 

(3) 

where


(4) 

The Relative Strength is defined by
(5) 

The Relative Strength Index (RSI) is defined by
(6) 

The Python script for computing the RSI and creating a RSI stock screener is given below.
First, you need to create a workspace folder and install the necessary libraries (we assume a Windows operating system).
cd\
mkdir testRSI
cd testRSI

python -m venv env1

env1\Scripts\activate.bat

pip install numpy pandas requests yfinance beautifulsoup4 lxml
The Python script that computes the RSI values and creates a stock screener is given below (for more details, see the video tutorial given above).
from datetime import datetime, timedelta
from io import StringIO
import numpy as np
import pandas as pd
import requests
import yfinance as yf
from bs4 import BeautifulSoup

import tkinter as tk
from tkinter import ttk

# Parameters

download_interval = 1000
# here, you select the RSI value
period_rsi = 7


address = "https://en.wikipedia.org/wiki/List_of_S%26P_500_companies"
headers = {"User-Agent": "Mozilla/5.0"}

# 1. Fetch S&P 500 Tickers
response = requests.get(address, headers=headers, timeout=10)
soup = BeautifulSoup(response.text, 'html.parser')
table = soup.find('table', id='constituents')

# Save inspection files
with open("wikipedia_sp500.html", "w", encoding="utf-8") as file:
    file.write(soup.prettify())

with open("table_sp500.html", "w", encoding="utf-8") as file:
    file.write(table.prettify())

# Parse table
df = pd.read_html(StringIO(str(table)))[0]
df.to_csv("sp500_companies.csv", index=False)
print("Saved successfully! Total rows:", len(df))

# Clean ticker symbols safely (replaces dots with dashes, e.g., BRK.B -> BRK-B)
tickers = df['Symbol'].str.replace('.', '-', regex=False).tolist()


# 2. RSI Calculation Function
def calculate_rsi(series, period=period_rsi):
    delta = series.diff()
    gain = delta.clip(lower=0)
    loss = -1 * delta.clip(upper=0)

    # Exponentially Weighted Moving
    avg_gain = gain.ewm(alpha=1/period, min_periods=period, adjust=False).mean()
    avg_loss = loss.ewm(alpha=1/period, min_periods=period, adjust=False).mean()

    rs = np.where(avg_loss == 0, np.nan, avg_gain / avg_loss)
    rsi = 100 - (100 / (1 + rs))
    # Handles the edge case where prices went exclusively UP during the period
    # (avg_loss == 0 and avg_gain > 0).
    # In this case, RSI is explicitly capped at its maximum value of 100.
    rsi = np.where((avg_loss == 0) & (avg_gain > 0), 100, rsi)

    return pd.Series(rsi, index=series.index)


# 3. Data Downloading
start_date = (datetime.now() - timedelta(days=download_interval)).strftime('%Y-%m-%d')

print(f"\n1. Downloading daily historical data for {len(tickers)} stocks...")
daily_data = yf.download(
    tickers,
    start=start_date,
    interval="1d",
    progress=False,
    auto_adjust=True
)
daily_closes = daily_data['Close']

print("2. Batch-downloading live intraday ticks...")
# Request 5m or 1m data for live ticks
live_data = yf.download(
    tickers,
    period="1d",
    interval="5m",
    progress=False,
    auto_adjust=True
)
live_closes = live_data['Close']

# Standardize DataFrames if single-ticker edge case occurs
if isinstance(daily_closes, pd.Series):
    daily_closes = daily_closes.to_frame()
if isinstance(live_closes, pd.Series):
    live_closes = live_closes.to_frame()


# Save the downloaded stocks (both first daily download and live data)
daily_data.to_csv("daily_data.csv")
live_data.to_csv("live_data.csv")
print("\nData saved")


# 4. Process Tickers & Calculate RSI
print("\n3. Calculating RSI...")
latest_rsi_values = {}


for ticker in tickers:
    if ticker in daily_closes.columns:
        # Get daily series and strip timezone to avoid indexing bugs
        ticker_close = daily_closes[ticker].dropna().copy()
        if hasattr(ticker_close.index, 'tz_localize'):
            ticker_close.index = ticker_close.index.tz_localize(None)

        # Append latest live tick if available
        if ticker in live_closes.columns:
            ticker_live = live_closes[ticker].dropna()
            if not ticker_live.empty:
                latest_tick_price = ticker_live.iloc[-1]
                # Align date format without timezone mismatch
                latest_tick_date = pd.Timestamp(ticker_live.index[-1].date())
                ticker_close[latest_tick_date] = latest_tick_price

        # Deduplicate & sort
        ticker_close = ticker_close[~ticker_close.index.duplicated(keep='last')].sort_index()

        # Calculate RSI
        if len(ticker_close) > period_rsi:
            ticker_rsi = calculate_rsi(ticker_close, period=period_rsi)
            latest_val = ticker_rsi.iloc[-1]
            if not pd.isna(latest_val):
                latest_rsi_values[ticker] = round(float(latest_val), 2)

# Sort lowest to highest
sorted_rsi_values = dict(sorted(latest_rsi_values.items(), key=lambda item: item[1]))

print("\nLatest Sorted RSI Values:")
print(sorted_rsi_values)


# 2. Create and launch the Tkinter GUI
def open_gui():
    root = tk.Tk()
    root.title("S&P 500 RSI Dashboard")
    root.geometry("400x600")

    # Add a title label
    title_label = tk.Label(root, text="Current RSI (Lowest to Highest)", font=("Arial", 14, "bold"))
    title_label.pack(pady=10)

    # Create a frame for the table and scrollbar
    frame = tk.Frame(root)
    frame.pack(fill=tk.BOTH, expand=True, padx=20, pady=10)

    # Create the Treeview (Table)
    columns = ("Ticker", "RSI")
    tree = ttk.Treeview(frame, columns=columns, show="headings")
    tree.heading("Ticker", text="Stock Ticker")
    tree.heading("RSI", text="RSI")

    # Format the columns
    tree.column("Ticker", anchor="center", width=150)
    tree.column("RSI", anchor="center", width=150)

    # Add a vertical scrollbar
    scrollbar = ttk.Scrollbar(frame, orient=tk.VERTICAL, command=tree.yview)
    tree.configure(yscroll=scrollbar.set)

    # Pack the scrollbar and treeview
    scrollbar.pack(side=tk.RIGHT, fill=tk.Y)
    tree.pack(side=tk.LEFT, fill=tk.BOTH, expand=True)

    # Populate the table with the sorted RSI values
    for ticker, rsi in sorted_rsi_values.items():
        tree.insert("", tk.END, values=(ticker, rsi))

    # Run the application
    root.mainloop()

# Call the function to open the window
open_gui()