In this tutorial, we explain how to simulate a Bode plot (frequency response) of an active low-pass filter composed of an operational amplifier in LTspice. We explain how to correctly validate the simulation results by using analytically derived frequency response. The YouTube tutorial is given below.

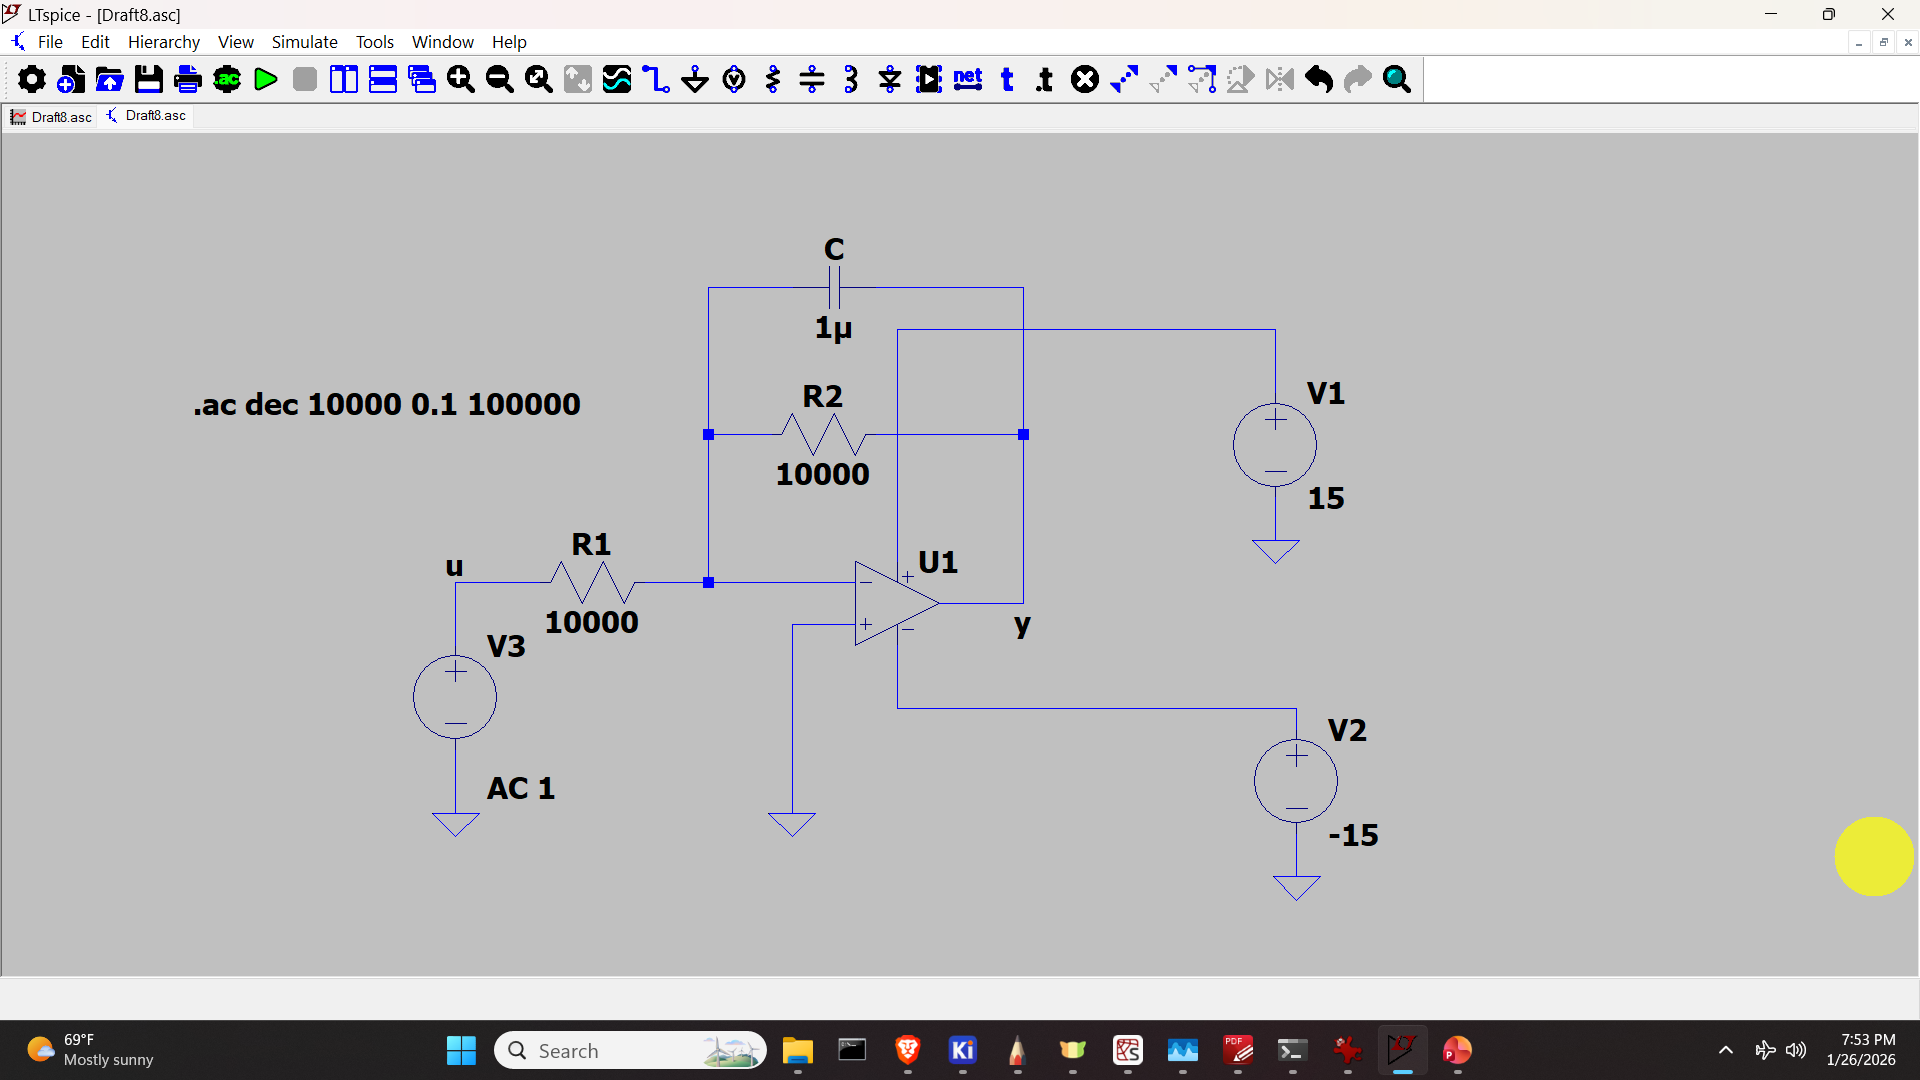
The low-pass active circuit is given below.

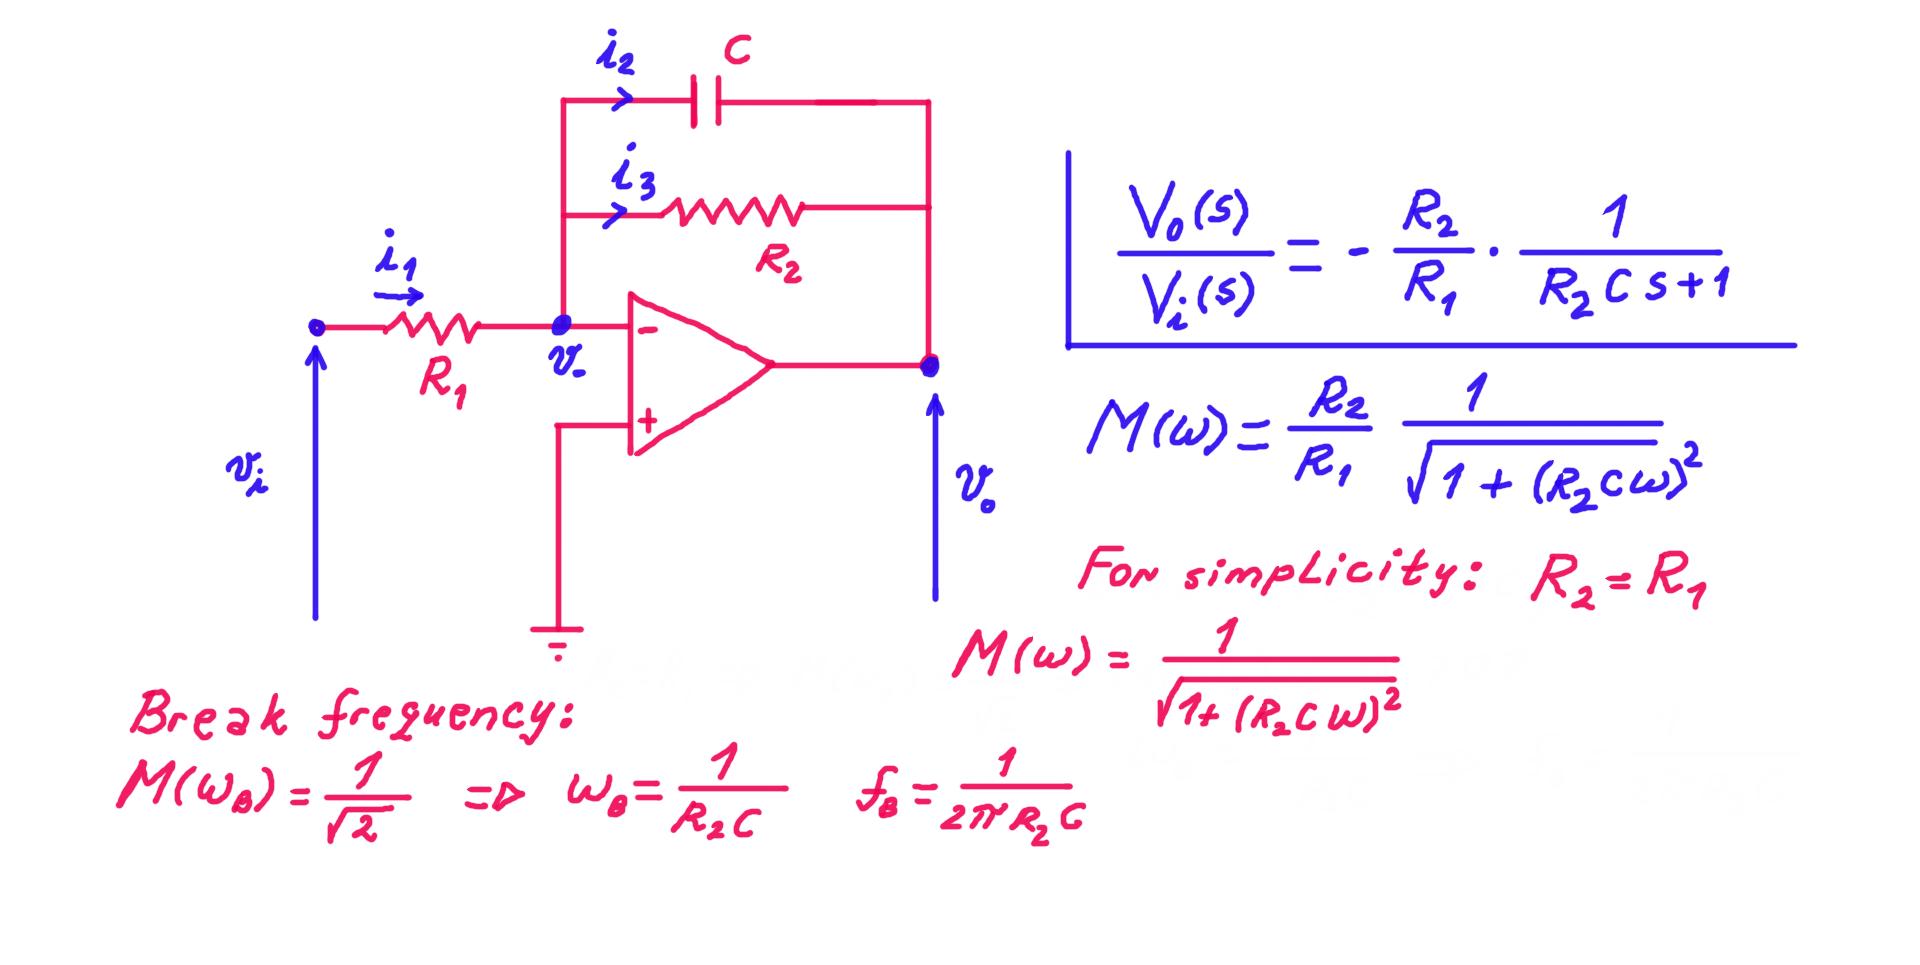
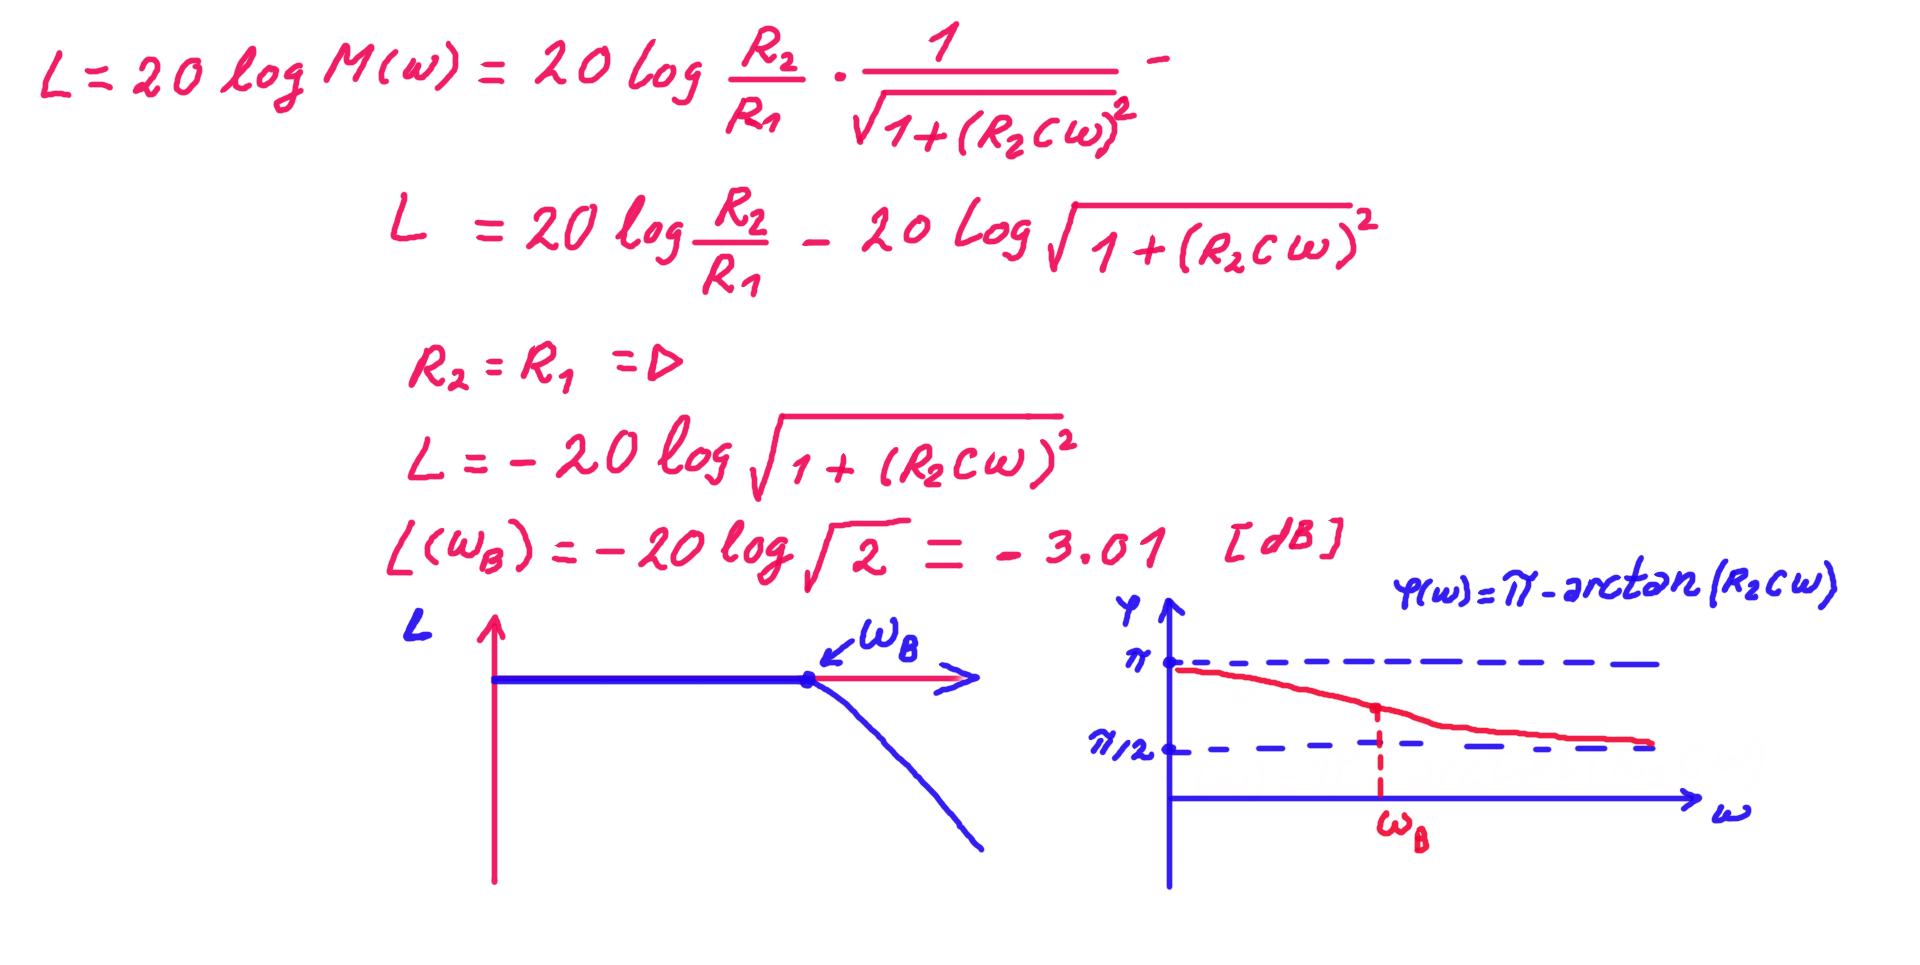
The analytical derivations used to validate the simulation results are given below.

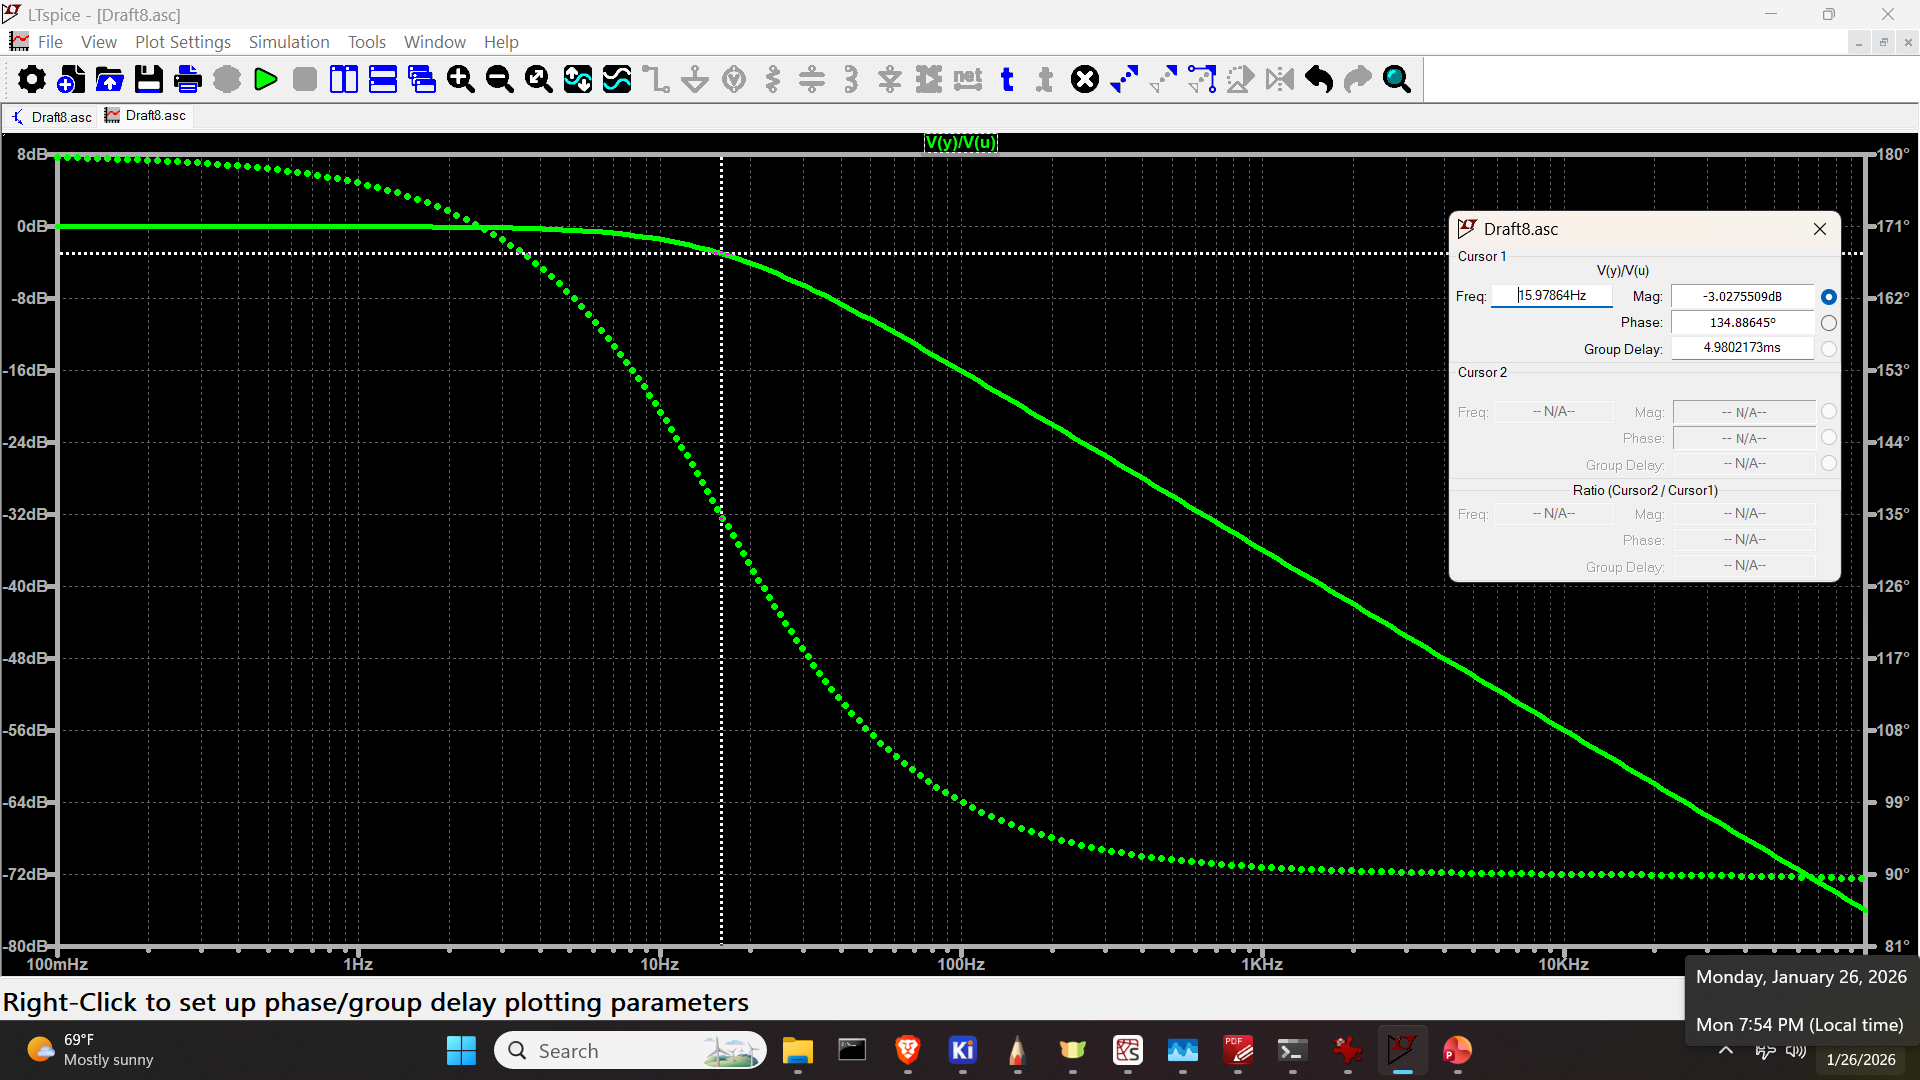
The simulation results are shown below.